Icelander vs Immigrants from Belarus Unemployment
COMPARE
Icelander
Immigrants from Belarus
Unemployment
Unemployment Comparison
Icelanders
Immigrants from Belarus
4.9%
UNEMPLOYMENT
98.9/ 100
METRIC RATING
62nd/ 347
METRIC RANK
5.3%
UNEMPLOYMENT
35.6/ 100
METRIC RATING
189th/ 347
METRIC RANK
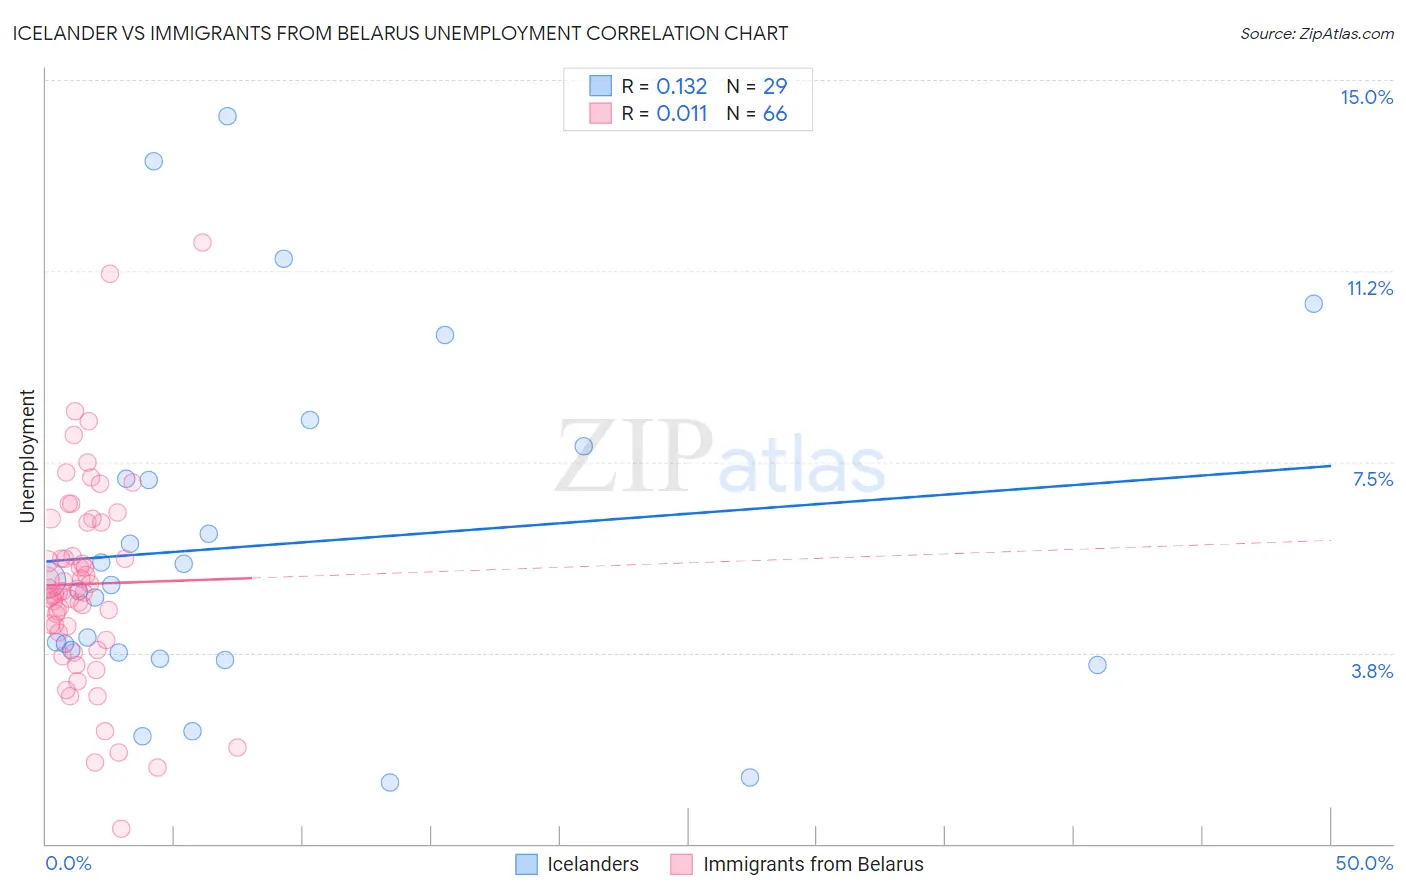
Icelander vs Immigrants from Belarus Unemployment Correlation Chart
The statistical analysis conducted on geographies consisting of 159,539,364 people shows a poor positive correlation between the proportion of Icelanders and unemployment in the United States with a correlation coefficient (R) of 0.132 and weighted average of 4.9%. Similarly, the statistical analysis conducted on geographies consisting of 150,154,457 people shows no correlation between the proportion of Immigrants from Belarus and unemployment in the United States with a correlation coefficient (R) of 0.011 and weighted average of 5.3%, a difference of 8.5%.
Unemployment Correlation Summary
| Measurement | Icelander | Immigrants from Belarus |
| Minimum | 1.2% | 0.30% |
| Maximum | 14.3% | 11.8% |
| Range | 13.1% | 11.5% |
| Mean | 5.9% | 5.1% |
| Median | 5.1% | 4.9% |
| Interquartile 25% (IQ1) | 3.7% | 4.2% |
| Interquartile 75% (IQ3) | 7.5% | 6.3% |
| Interquartile Range (IQR) | 3.8% | 2.1% |
| Standard Deviation (Sample) | 3.4% | 2.0% |
| Standard Deviation (Population) | 3.3% | 2.0% |
Similar Demographics by Unemployment
Demographics Similar to Icelanders by Unemployment
In terms of unemployment, the demographic groups most similar to Icelanders are Immigrants from Netherlands (4.9%, a difference of 0.010%), Cambodian (4.9%, a difference of 0.010%), Immigrants from Bulgaria (4.9%, a difference of 0.010%), Bhutanese (4.9%, a difference of 0.060%), and Greek (4.9%, a difference of 0.080%).
| Demographics | Rating | Rank | Unemployment |
| Australians | 99.2 /100 | #55 | Exceptional 4.9% |
| Celtics | 99.1 /100 | #56 | Exceptional 4.9% |
| Immigrants | Singapore | 99.1 /100 | #57 | Exceptional 4.9% |
| Greeks | 99.0 /100 | #58 | Exceptional 4.9% |
| Bhutanese | 99.0 /100 | #59 | Exceptional 4.9% |
| Immigrants | Netherlands | 99.0 /100 | #60 | Exceptional 4.9% |
| Cambodians | 99.0 /100 | #61 | Exceptional 4.9% |
| Icelanders | 98.9 /100 | #62 | Exceptional 4.9% |
| Immigrants | Bulgaria | 98.9 /100 | #63 | Exceptional 4.9% |
| Italians | 98.9 /100 | #64 | Exceptional 4.9% |
| Immigrants | Canada | 98.8 /100 | #65 | Exceptional 4.9% |
| Slovaks | 98.7 /100 | #66 | Exceptional 4.9% |
| New Zealanders | 98.6 /100 | #67 | Exceptional 4.9% |
| Slavs | 98.6 /100 | #68 | Exceptional 4.9% |
| Immigrants | North America | 98.5 /100 | #69 | Exceptional 4.9% |
Demographics Similar to Immigrants from Belarus by Unemployment
In terms of unemployment, the demographic groups most similar to Immigrants from Belarus are Arab (5.3%, a difference of 0.020%), Alsatian (5.3%, a difference of 0.090%), Somali (5.3%, a difference of 0.11%), South American (5.3%, a difference of 0.11%), and Costa Rican (5.3%, a difference of 0.12%).
| Demographics | Rating | Rank | Unemployment |
| Spaniards | 42.2 /100 | #182 | Average 5.3% |
| Brazilians | 40.2 /100 | #183 | Average 5.3% |
| Assyrians/Chaldeans/Syriacs | 39.2 /100 | #184 | Fair 5.3% |
| Immigrants | Thailand | 38.9 /100 | #185 | Fair 5.3% |
| Immigrants | Uganda | 37.8 /100 | #186 | Fair 5.3% |
| Costa Ricans | 37.4 /100 | #187 | Fair 5.3% |
| Alsatians | 37.0 /100 | #188 | Fair 5.3% |
| Immigrants | Belarus | 35.6 /100 | #189 | Fair 5.3% |
| Arabs | 35.3 /100 | #190 | Fair 5.3% |
| Somalis | 34.0 /100 | #191 | Fair 5.3% |
| South Americans | 33.9 /100 | #192 | Fair 5.3% |
| Immigrants | Somalia | 33.8 /100 | #193 | Fair 5.3% |
| Immigrants | Laos | 30.9 /100 | #194 | Fair 5.3% |
| Immigrants | Southern Europe | 30.9 /100 | #195 | Fair 5.3% |
| Peruvians | 29.9 /100 | #196 | Fair 5.3% |