Choctaw vs Immigrants from Belarus Unemployment
COMPARE
Choctaw
Immigrants from Belarus
Unemployment
Unemployment Comparison
Choctaw
Immigrants from Belarus
5.4%
UNEMPLOYMENT
12.7/ 100
METRIC RATING
218th/ 347
METRIC RANK
5.3%
UNEMPLOYMENT
35.6/ 100
METRIC RATING
189th/ 347
METRIC RANK
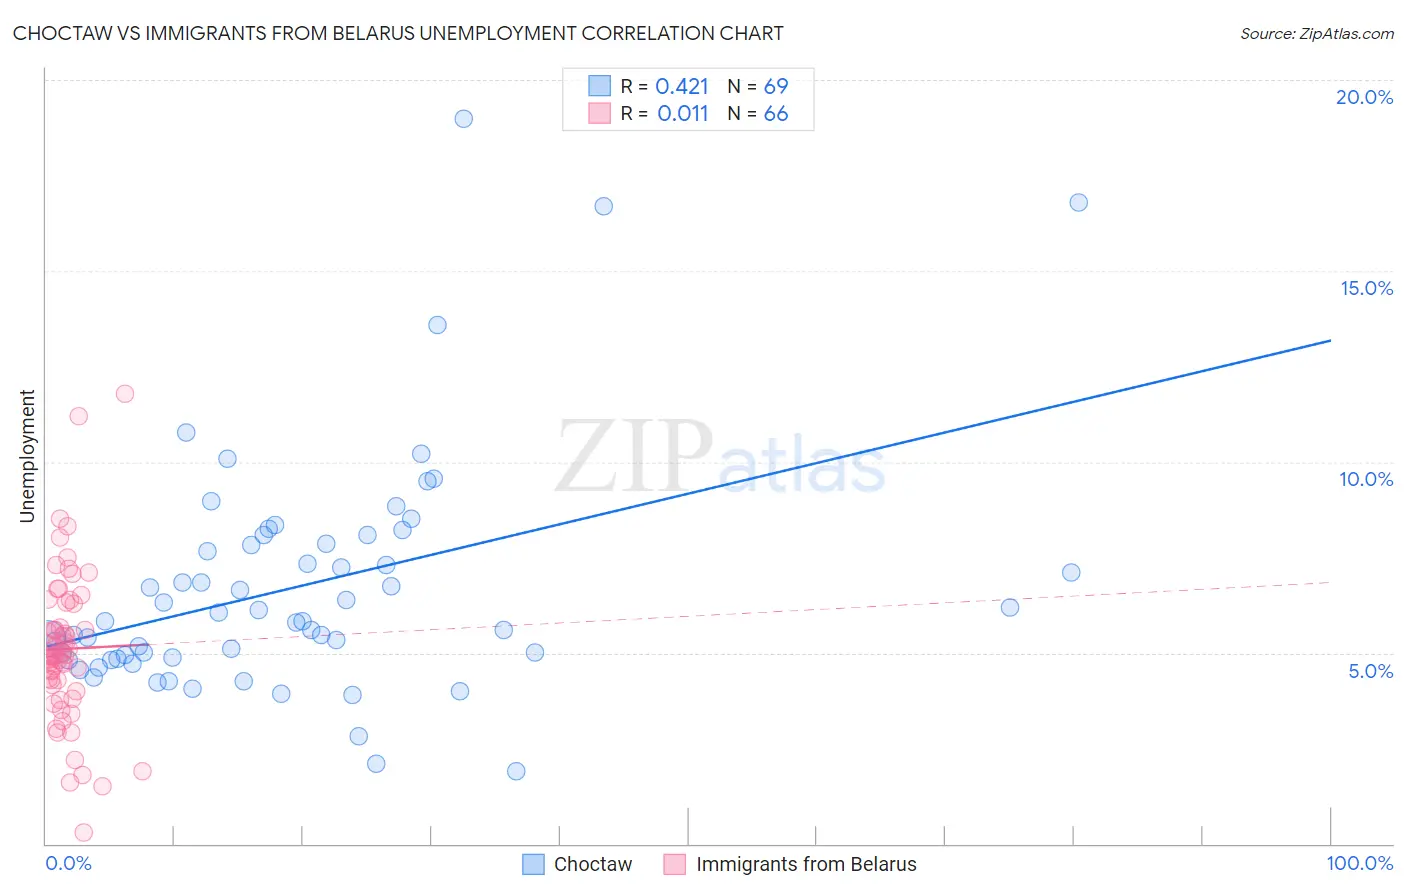
Choctaw vs Immigrants from Belarus Unemployment Correlation Chart
The statistical analysis conducted on geographies consisting of 269,338,927 people shows a moderate positive correlation between the proportion of Choctaw and unemployment in the United States with a correlation coefficient (R) of 0.421 and weighted average of 5.4%. Similarly, the statistical analysis conducted on geographies consisting of 150,154,457 people shows no correlation between the proportion of Immigrants from Belarus and unemployment in the United States with a correlation coefficient (R) of 0.011 and weighted average of 5.3%, a difference of 2.0%.
Unemployment Correlation Summary
| Measurement | Choctaw | Immigrants from Belarus |
| Minimum | 1.9% | 0.30% |
| Maximum | 19.0% | 11.8% |
| Range | 17.1% | 11.5% |
| Mean | 6.7% | 5.1% |
| Median | 5.8% | 4.9% |
| Interquartile 25% (IQ1) | 4.9% | 4.2% |
| Interquartile 75% (IQ3) | 8.0% | 6.3% |
| Interquartile Range (IQR) | 3.1% | 2.1% |
| Standard Deviation (Sample) | 3.1% | 2.0% |
| Standard Deviation (Population) | 3.1% | 2.0% |
Similar Demographics by Unemployment
Demographics Similar to Choctaw by Unemployment
In terms of unemployment, the demographic groups most similar to Choctaw are Immigrants from South America (5.4%, a difference of 0.10%), Immigrants from Albania (5.4%, a difference of 0.10%), Bangladeshi (5.4%, a difference of 0.22%), Delaware (5.4%, a difference of 0.26%), and Soviet Union (5.4%, a difference of 0.30%).
| Demographics | Rating | Rank | Unemployment |
| Iraqis | 18.1 /100 | #211 | Poor 5.4% |
| Ugandans | 18.0 /100 | #212 | Poor 5.4% |
| Immigrants | Middle Africa | 15.3 /100 | #213 | Poor 5.4% |
| Immigrants | Costa Rica | 15.2 /100 | #214 | Poor 5.4% |
| Delaware | 14.7 /100 | #215 | Poor 5.4% |
| Immigrants | South America | 13.5 /100 | #216 | Poor 5.4% |
| Immigrants | Albania | 13.5 /100 | #217 | Poor 5.4% |
| Choctaw | 12.7 /100 | #218 | Poor 5.4% |
| Bangladeshis | 11.2 /100 | #219 | Poor 5.4% |
| Soviet Union | 10.6 /100 | #220 | Poor 5.4% |
| Immigrants | Philippines | 10.4 /100 | #221 | Poor 5.4% |
| Iroquois | 10.3 /100 | #222 | Poor 5.4% |
| Seminole | 9.2 /100 | #223 | Tragic 5.4% |
| Israelis | 8.8 /100 | #224 | Tragic 5.4% |
| South American Indians | 7.8 /100 | #225 | Tragic 5.5% |
Demographics Similar to Immigrants from Belarus by Unemployment
In terms of unemployment, the demographic groups most similar to Immigrants from Belarus are Arab (5.3%, a difference of 0.020%), Alsatian (5.3%, a difference of 0.090%), Somali (5.3%, a difference of 0.11%), South American (5.3%, a difference of 0.11%), and Costa Rican (5.3%, a difference of 0.12%).
| Demographics | Rating | Rank | Unemployment |
| Spaniards | 42.2 /100 | #182 | Average 5.3% |
| Brazilians | 40.2 /100 | #183 | Average 5.3% |
| Assyrians/Chaldeans/Syriacs | 39.2 /100 | #184 | Fair 5.3% |
| Immigrants | Thailand | 38.9 /100 | #185 | Fair 5.3% |
| Immigrants | Uganda | 37.8 /100 | #186 | Fair 5.3% |
| Costa Ricans | 37.4 /100 | #187 | Fair 5.3% |
| Alsatians | 37.0 /100 | #188 | Fair 5.3% |
| Immigrants | Belarus | 35.6 /100 | #189 | Fair 5.3% |
| Arabs | 35.3 /100 | #190 | Fair 5.3% |
| Somalis | 34.0 /100 | #191 | Fair 5.3% |
| South Americans | 33.9 /100 | #192 | Fair 5.3% |
| Immigrants | Somalia | 33.8 /100 | #193 | Fair 5.3% |
| Immigrants | Laos | 30.9 /100 | #194 | Fair 5.3% |
| Immigrants | Southern Europe | 30.9 /100 | #195 | Fair 5.3% |
| Peruvians | 29.9 /100 | #196 | Fair 5.3% |