West Indian vs Central American Indian Male Unemployment
COMPARE
West Indian
Central American Indian
Male Unemployment
Male Unemployment Comparison
West Indians
Central American Indians
6.7%
MALE UNEMPLOYMENT
0.0/ 100
METRIC RATING
304th/ 347
METRIC RANK
6.3%
MALE UNEMPLOYMENT
0.0/ 100
METRIC RATING
287th/ 347
METRIC RANK
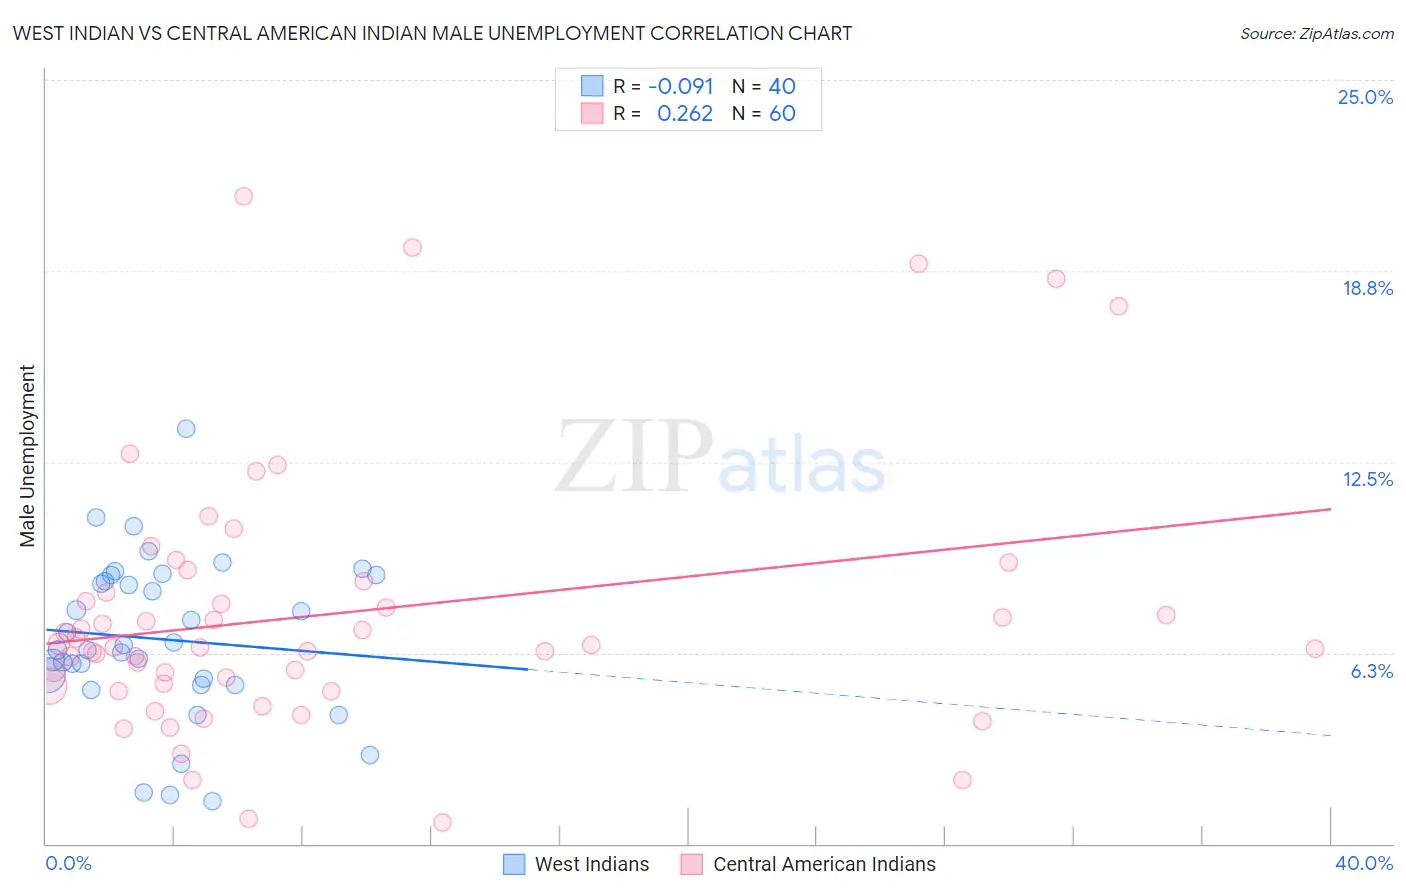
West Indian vs Central American Indian Male Unemployment Correlation Chart
The statistical analysis conducted on geographies consisting of 253,602,585 people shows a slight negative correlation between the proportion of West Indians and unemployment rate among males in the United States with a correlation coefficient (R) of -0.091 and weighted average of 6.7%. Similarly, the statistical analysis conducted on geographies consisting of 325,394,182 people shows a weak positive correlation between the proportion of Central American Indians and unemployment rate among males in the United States with a correlation coefficient (R) of 0.262 and weighted average of 6.3%, a difference of 6.2%.
Male Unemployment Correlation Summary
| Measurement | West Indian | Central American Indian |
| Minimum | 1.4% | 0.70% |
| Maximum | 13.6% | 21.2% |
| Range | 12.2% | 20.5% |
| Mean | 6.7% | 7.5% |
| Median | 6.4% | 6.5% |
| Interquartile 25% (IQ1) | 5.3% | 5.2% |
| Interquartile 75% (IQ3) | 8.7% | 8.4% |
| Interquartile Range (IQR) | 3.4% | 3.2% |
| Standard Deviation (Sample) | 2.6% | 4.3% |
| Standard Deviation (Population) | 2.6% | 4.3% |
Demographics Similar to West Indians and Central American Indians by Male Unemployment
In terms of male unemployment, the demographic groups most similar to West Indians are Immigrants from West Indies (6.7%, a difference of 0.0%), Trinidadian and Tobagonian (6.7%, a difference of 0.32%), Ute (6.6%, a difference of 0.37%), Immigrants from Belize (6.6%, a difference of 1.1%), and Vietnamese (6.6%, a difference of 1.2%). Similarly, the demographic groups most similar to Central American Indians are Immigrants from Senegal (6.3%, a difference of 0.040%), Immigrants from Caribbean (6.3%, a difference of 0.16%), African (6.3%, a difference of 0.29%), Immigrants from Ecuador (6.2%, a difference of 0.72%), and U.S. Virgin Islander (6.4%, a difference of 1.7%).
| Demographics | Rating | Rank | Male Unemployment |
| Immigrants | Ecuador | 0.0 /100 | #285 | Tragic 6.2% |
| Africans | 0.0 /100 | #286 | Tragic 6.3% |
| Central American Indians | 0.0 /100 | #287 | Tragic 6.3% |
| Immigrants | Senegal | 0.0 /100 | #288 | Tragic 6.3% |
| Immigrants | Caribbean | 0.0 /100 | #289 | Tragic 6.3% |
| U.S. Virgin Islanders | 0.0 /100 | #290 | Tragic 6.4% |
| Immigrants | Azores | 0.0 /100 | #291 | Tragic 6.4% |
| Nepalese | 0.0 /100 | #292 | Tragic 6.4% |
| Haitians | 0.0 /100 | #293 | Tragic 6.4% |
| Senegalese | 0.0 /100 | #294 | Tragic 6.4% |
| Belizeans | 0.0 /100 | #295 | Tragic 6.5% |
| Immigrants | Haiti | 0.0 /100 | #296 | Tragic 6.5% |
| Chippewa | 0.0 /100 | #297 | Tragic 6.6% |
| Jamaicans | 0.0 /100 | #298 | Tragic 6.6% |
| Immigrants | Bangladesh | 0.0 /100 | #299 | Tragic 6.6% |
| Vietnamese | 0.0 /100 | #300 | Tragic 6.6% |
| Immigrants | Belize | 0.0 /100 | #301 | Tragic 6.6% |
| Ute | 0.0 /100 | #302 | Tragic 6.6% |
| Immigrants | West Indies | 0.0 /100 | #303 | Tragic 6.7% |
| West Indians | 0.0 /100 | #304 | Tragic 6.7% |
| Trinidadians and Tobagonians | 0.0 /100 | #305 | Tragic 6.7% |