West Indian vs Cree Disability Age Over 75
COMPARE
West Indian
Cree
Disability Age Over 75
Disability Age Over 75 Comparison
West Indians
Cree
48.6%
DISABILITY AGE OVER 75
0.8/ 100
METRIC RATING
250th/ 347
METRIC RANK
48.2%
DISABILITY AGE OVER 75
4.2/ 100
METRIC RATING
233rd/ 347
METRIC RANK
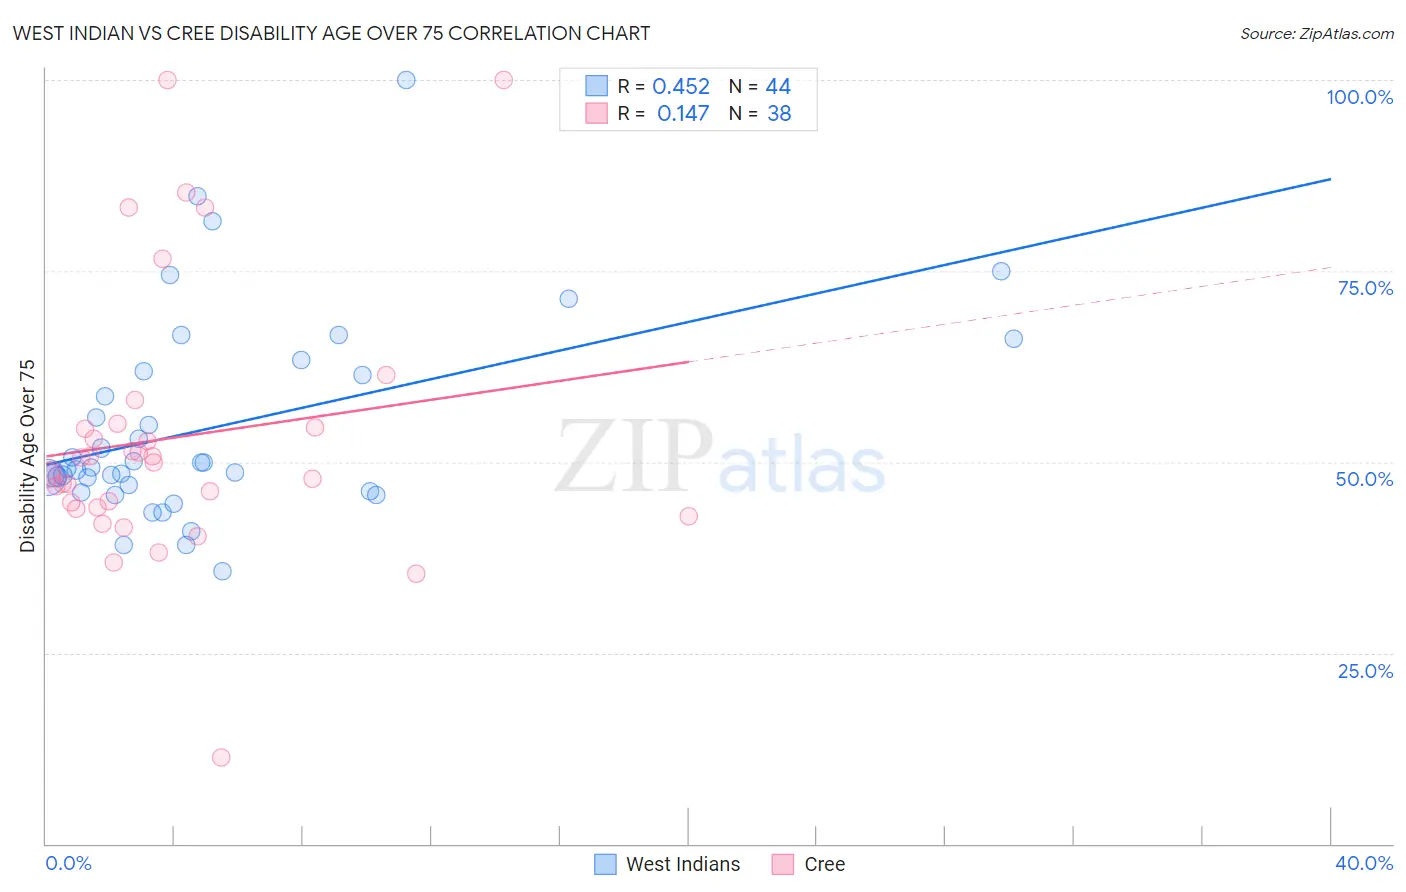
West Indian vs Cree Disability Age Over 75 Correlation Chart
The statistical analysis conducted on geographies consisting of 253,625,945 people shows a moderate positive correlation between the proportion of West Indians and percentage of population with a disability over the age of 75 in the United States with a correlation coefficient (R) of 0.452 and weighted average of 48.6%. Similarly, the statistical analysis conducted on geographies consisting of 76,193,108 people shows a poor positive correlation between the proportion of Cree and percentage of population with a disability over the age of 75 in the United States with a correlation coefficient (R) of 0.147 and weighted average of 48.2%, a difference of 0.92%.
Disability Age Over 75 Correlation Summary
| Measurement | West Indian | Cree |
| Minimum | 35.7% | 11.2% |
| Maximum | 100.0% | 100.0% |
| Range | 64.3% | 88.8% |
| Mean | 54.5% | 53.2% |
| Median | 49.1% | 49.4% |
| Interquartile 25% (IQ1) | 46.6% | 44.0% |
| Interquartile 75% (IQ3) | 61.6% | 54.4% |
| Interquartile Range (IQR) | 15.0% | 10.4% |
| Standard Deviation (Sample) | 13.3% | 17.7% |
| Standard Deviation (Population) | 13.2% | 17.5% |
Demographics Similar to West Indians and Cree by Disability Age Over 75
In terms of disability age over 75, the demographic groups most similar to West Indians are Korean (48.6%, a difference of 0.020%), Iraqi (48.6%, a difference of 0.080%), Sri Lankan (48.5%, a difference of 0.29%), Iroquois (48.4%, a difference of 0.35%), and Chippewa (48.4%, a difference of 0.37%). Similarly, the demographic groups most similar to Cree are Indonesian (48.2%, a difference of 0.0%), Immigrants (48.2%, a difference of 0.020%), Subsaharan African (48.2%, a difference of 0.060%), Hmong (48.2%, a difference of 0.070%), and Immigrants from Nicaragua (48.2%, a difference of 0.16%).
| Demographics | Rating | Rank | Disability Age Over 75 |
| Immigrants | Immigrants | 4.3 /100 | #231 | Tragic 48.2% |
| Indonesians | 4.2 /100 | #232 | Tragic 48.2% |
| Cree | 4.2 /100 | #233 | Tragic 48.2% |
| Sub-Saharan Africans | 3.8 /100 | #234 | Tragic 48.2% |
| Hmong | 3.8 /100 | #235 | Tragic 48.2% |
| Immigrants | Nicaragua | 3.2 /100 | #236 | Tragic 48.2% |
| Immigrants | St. Vincent and the Grenadines | 3.2 /100 | #237 | Tragic 48.2% |
| Nicaraguans | 3.0 /100 | #238 | Tragic 48.3% |
| Immigrants | Thailand | 2.8 /100 | #239 | Tragic 48.3% |
| Tongans | 2.3 /100 | #240 | Tragic 48.3% |
| Native Hawaiians | 2.2 /100 | #241 | Tragic 48.3% |
| French American Indians | 2.2 /100 | #242 | Tragic 48.3% |
| Immigrants | Caribbean | 2.1 /100 | #243 | Tragic 48.4% |
| Afghans | 1.8 /100 | #244 | Tragic 48.4% |
| Americans | 1.7 /100 | #245 | Tragic 48.4% |
| Chippewa | 1.6 /100 | #246 | Tragic 48.4% |
| Iroquois | 1.6 /100 | #247 | Tragic 48.4% |
| Sri Lankans | 1.4 /100 | #248 | Tragic 48.5% |
| Iraqis | 1.0 /100 | #249 | Tragic 48.6% |
| West Indians | 0.8 /100 | #250 | Tragic 48.6% |
| Koreans | 0.8 /100 | #251 | Tragic 48.6% |