Basque vs Immigrants from Sudan Female Unemployment
COMPARE
Basque
Immigrants from Sudan
Female Unemployment
Female Unemployment Comparison
Basques
Immigrants from Sudan
5.1%
FEMALE UNEMPLOYMENT
86.5/ 100
METRIC RATING
125th/ 347
METRIC RANK
5.0%
FEMALE UNEMPLOYMENT
96.7/ 100
METRIC RATING
88th/ 347
METRIC RANK
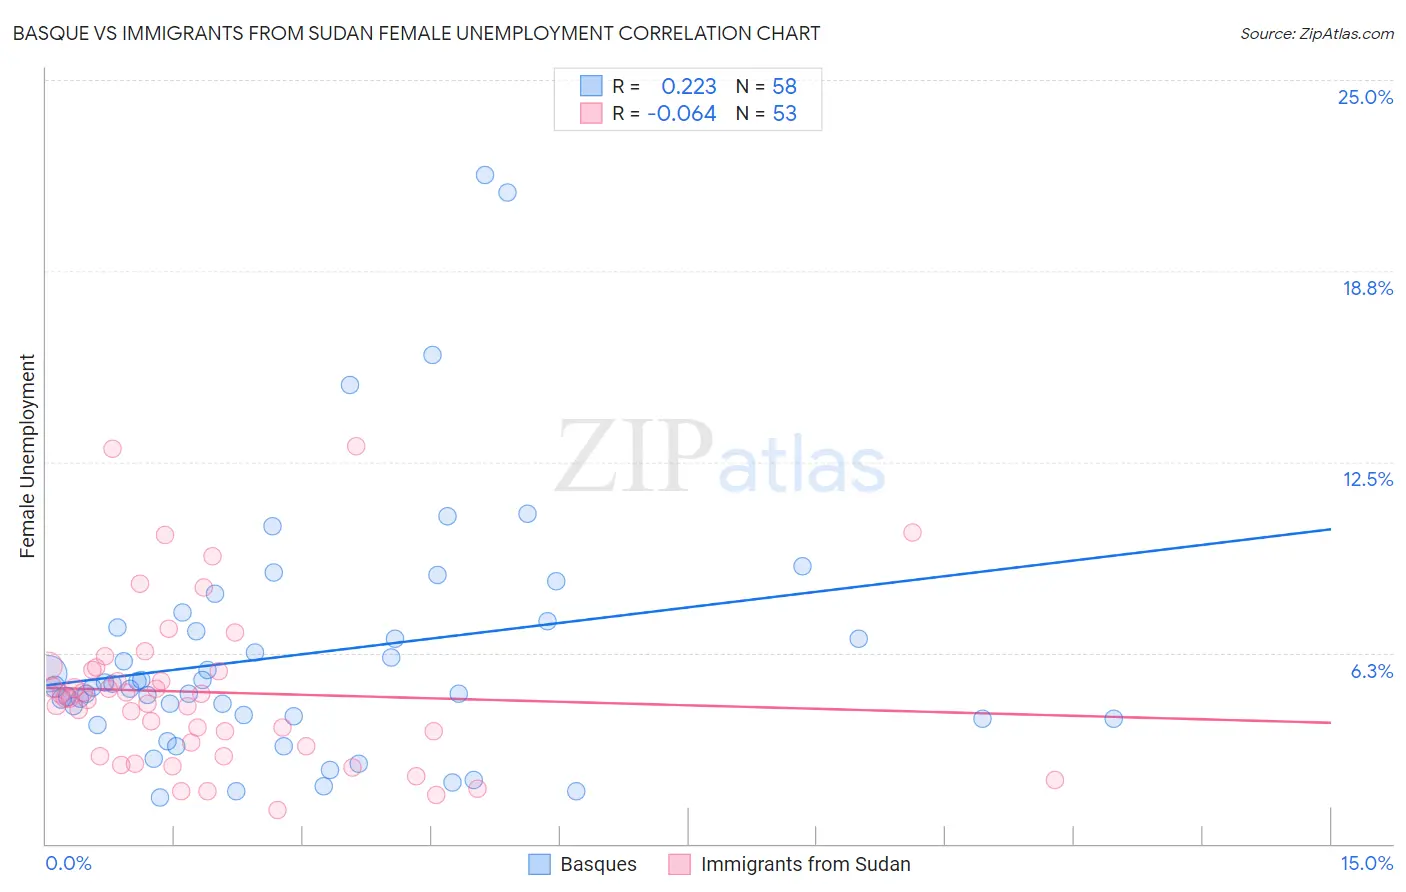
Basque vs Immigrants from Sudan Female Unemployment Correlation Chart
The statistical analysis conducted on geographies consisting of 165,405,269 people shows a weak positive correlation between the proportion of Basques and unemploymnet rate among females in the United States with a correlation coefficient (R) of 0.223 and weighted average of 5.1%. Similarly, the statistical analysis conducted on geographies consisting of 118,886,024 people shows a slight negative correlation between the proportion of Immigrants from Sudan and unemploymnet rate among females in the United States with a correlation coefficient (R) of -0.064 and weighted average of 5.0%, a difference of 2.4%.
Female Unemployment Correlation Summary
| Measurement | Basque | Immigrants from Sudan |
| Minimum | 1.5% | 1.1% |
| Maximum | 21.9% | 13.0% |
| Range | 20.4% | 11.9% |
| Mean | 6.2% | 5.0% |
| Median | 5.1% | 4.7% |
| Interquartile 25% (IQ1) | 4.1% | 3.0% |
| Interquartile 75% (IQ3) | 7.1% | 5.7% |
| Interquartile Range (IQR) | 3.0% | 2.7% |
| Standard Deviation (Sample) | 4.1% | 2.6% |
| Standard Deviation (Population) | 4.1% | 2.6% |
Similar Demographics by Female Unemployment
Demographics Similar to Basques by Female Unemployment
In terms of female unemployment, the demographic groups most similar to Basques are Immigrants from Korea (5.1%, a difference of 0.020%), Immigrants from Hungary (5.1%, a difference of 0.060%), Chilean (5.1%, a difference of 0.090%), Immigrants from Europe (5.1%, a difference of 0.10%), and Ethiopian (5.1%, a difference of 0.10%).
| Demographics | Rating | Rank | Female Unemployment |
| Immigrants | Croatia | 89.9 /100 | #118 | Excellent 5.1% |
| Immigrants | North Macedonia | 88.3 /100 | #119 | Excellent 5.1% |
| Immigrants | Romania | 88.1 /100 | #120 | Excellent 5.1% |
| Immigrants | Western Europe | 88.1 /100 | #121 | Excellent 5.1% |
| Immigrants | Germany | 87.6 /100 | #122 | Excellent 5.1% |
| Immigrants | South Africa | 87.6 /100 | #123 | Excellent 5.1% |
| Immigrants | Europe | 87.2 /100 | #124 | Excellent 5.1% |
| Basques | 86.5 /100 | #125 | Excellent 5.1% |
| Immigrants | Korea | 86.3 /100 | #126 | Excellent 5.1% |
| Immigrants | Hungary | 86.0 /100 | #127 | Excellent 5.1% |
| Chileans | 85.8 /100 | #128 | Excellent 5.1% |
| Ethiopians | 85.7 /100 | #129 | Excellent 5.1% |
| Maltese | 85.5 /100 | #130 | Excellent 5.1% |
| Immigrants | Ethiopia | 85.4 /100 | #131 | Excellent 5.1% |
| Immigrants | Sri Lanka | 85.0 /100 | #132 | Excellent 5.1% |
Demographics Similar to Immigrants from Sudan by Female Unemployment
In terms of female unemployment, the demographic groups most similar to Immigrants from Sudan are Immigrants from Taiwan (5.0%, a difference of 0.060%), Venezuelan (5.0%, a difference of 0.090%), Bolivian (5.0%, a difference of 0.18%), Ukrainian (5.0%, a difference of 0.19%), and Immigrants from Sweden (5.0%, a difference of 0.22%).
| Demographics | Rating | Rank | Female Unemployment |
| Filipinos | 97.3 /100 | #81 | Exceptional 5.0% |
| Immigrants | Australia | 97.3 /100 | #82 | Exceptional 5.0% |
| Immigrants | Serbia | 97.2 /100 | #83 | Exceptional 5.0% |
| Canadians | 97.2 /100 | #84 | Exceptional 5.0% |
| Ukrainians | 97.1 /100 | #85 | Exceptional 5.0% |
| Bolivians | 97.1 /100 | #86 | Exceptional 5.0% |
| Venezuelans | 96.9 /100 | #87 | Exceptional 5.0% |
| Immigrants | Sudan | 96.7 /100 | #88 | Exceptional 5.0% |
| Immigrants | Taiwan | 96.6 /100 | #89 | Exceptional 5.0% |
| Immigrants | Sweden | 96.3 /100 | #90 | Exceptional 5.0% |
| Immigrants | Japan | 96.0 /100 | #91 | Exceptional 5.0% |
| Romanians | 95.9 /100 | #92 | Exceptional 5.0% |
| Immigrants | Austria | 95.7 /100 | #93 | Exceptional 5.0% |
| Immigrants | Malaysia | 95.7 /100 | #94 | Exceptional 5.0% |
| Burmese | 95.6 /100 | #95 | Exceptional 5.0% |