Ute vs Alaska Native Unemployment
COMPARE
Ute
Alaska Native
Unemployment
Unemployment Comparison
Ute
Alaska Natives
6.3%
UNEMPLOYMENT
0.0/ 100
METRIC RATING
296th/ 347
METRIC RANK
7.2%
UNEMPLOYMENT
0.0/ 100
METRIC RATING
329th/ 347
METRIC RANK
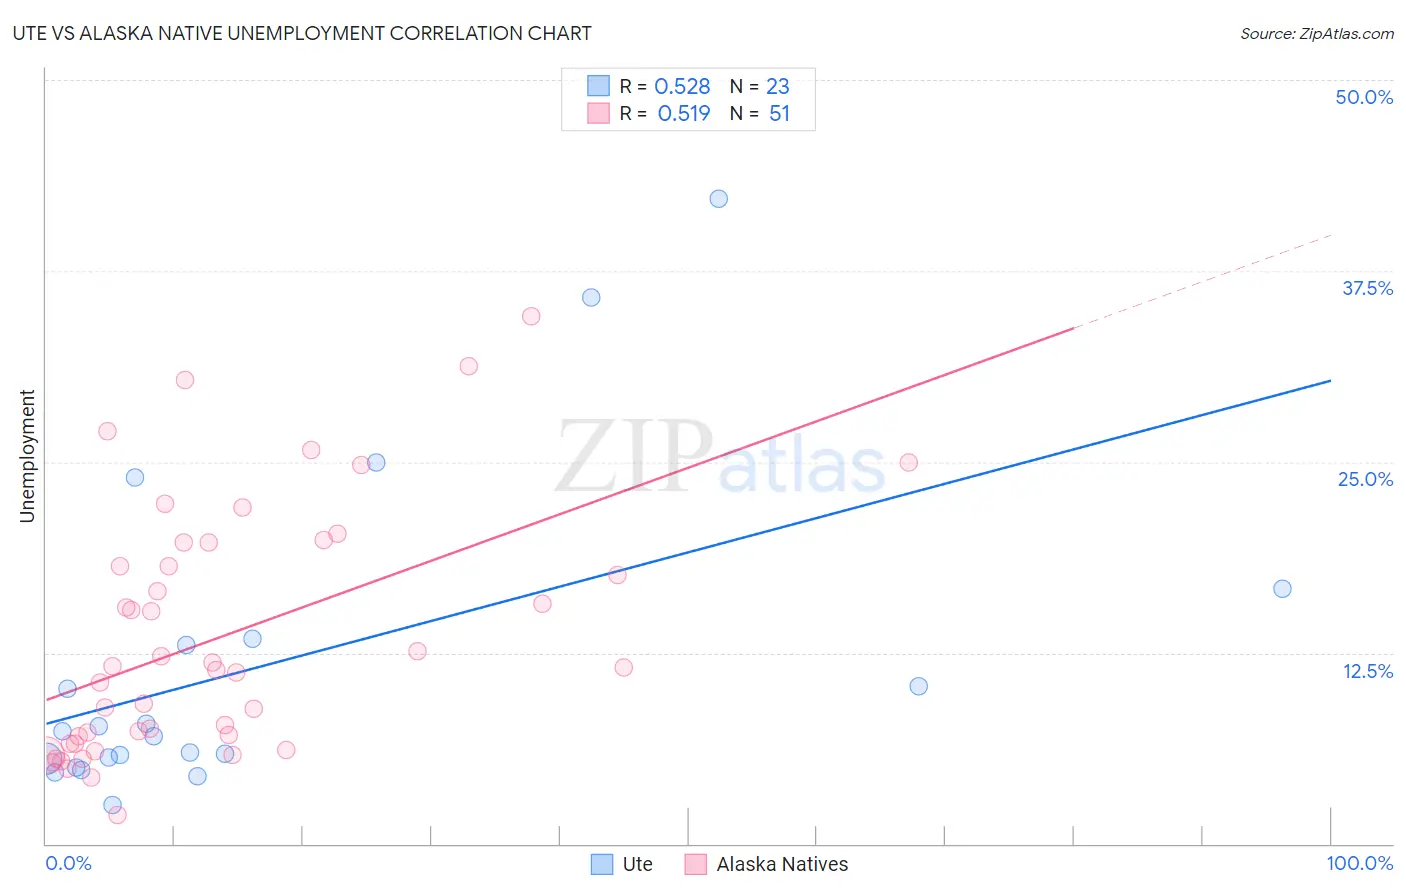
Ute vs Alaska Native Unemployment Correlation Chart
The statistical analysis conducted on geographies consisting of 55,641,971 people shows a substantial positive correlation between the proportion of Ute and unemployment in the United States with a correlation coefficient (R) of 0.528 and weighted average of 6.3%. Similarly, the statistical analysis conducted on geographies consisting of 76,749,531 people shows a substantial positive correlation between the proportion of Alaska Natives and unemployment in the United States with a correlation coefficient (R) of 0.519 and weighted average of 7.2%, a difference of 15.3%.
Unemployment Correlation Summary
| Measurement | Ute | Alaska Native |
| Minimum | 2.5% | 1.9% |
| Maximum | 42.2% | 34.5% |
| Range | 39.7% | 32.6% |
| Mean | 11.8% | 13.5% |
| Median | 7.3% | 11.5% |
| Interquartile 25% (IQ1) | 5.5% | 6.6% |
| Interquartile 75% (IQ3) | 13.4% | 19.7% |
| Interquartile Range (IQR) | 7.9% | 13.1% |
| Standard Deviation (Sample) | 10.4% | 8.0% |
| Standard Deviation (Population) | 10.2% | 8.0% |
Similar Demographics by Unemployment
Demographics Similar to Ute by Unemployment
In terms of unemployment, the demographic groups most similar to Ute are Jamaican (6.3%, a difference of 0.34%), Immigrants from Haiti (6.3%, a difference of 0.43%), U.S. Virgin Islander (6.3%, a difference of 0.45%), Immigrants from West Indies (6.3%, a difference of 0.48%), and Immigrants from Ecuador (6.2%, a difference of 0.57%).
| Demographics | Rating | Rank | Unemployment |
| Chippewa | 0.0 /100 | #289 | Tragic 6.2% |
| Senegalese | 0.0 /100 | #290 | Tragic 6.2% |
| Haitians | 0.0 /100 | #291 | Tragic 6.2% |
| Central American Indians | 0.0 /100 | #292 | Tragic 6.2% |
| Immigrants | Ecuador | 0.0 /100 | #293 | Tragic 6.2% |
| Spanish American Indians | 0.0 /100 | #294 | Tragic 6.2% |
| U.S. Virgin Islanders | 0.0 /100 | #295 | Tragic 6.3% |
| Ute | 0.0 /100 | #296 | Tragic 6.3% |
| Jamaicans | 0.0 /100 | #297 | Tragic 6.3% |
| Immigrants | Haiti | 0.0 /100 | #298 | Tragic 6.3% |
| Immigrants | West Indies | 0.0 /100 | #299 | Tragic 6.3% |
| Immigrants | Trinidad and Tobago | 0.0 /100 | #300 | Tragic 6.3% |
| Trinidadians and Tobagonians | 0.0 /100 | #301 | Tragic 6.3% |
| West Indians | 0.0 /100 | #302 | Tragic 6.4% |
| Belizeans | 0.0 /100 | #303 | Tragic 6.4% |
Demographics Similar to Alaska Natives by Unemployment
In terms of unemployment, the demographic groups most similar to Alaska Natives are Tsimshian (7.2%, a difference of 0.31%), Pueblo (7.2%, a difference of 1.2%), Yakama (7.3%, a difference of 1.3%), Dominican (7.4%, a difference of 1.6%), and Paiute (7.1%, a difference of 1.8%).
| Demographics | Rating | Rank | Unemployment |
| Guyanese | 0.0 /100 | #322 | Tragic 6.9% |
| Immigrants | Grenada | 0.0 /100 | #323 | Tragic 6.9% |
| Immigrants | Armenia | 0.0 /100 | #324 | Tragic 7.0% |
| Natives/Alaskans | 0.0 /100 | #325 | Tragic 7.0% |
| Paiute | 0.0 /100 | #326 | Tragic 7.1% |
| Pueblo | 0.0 /100 | #327 | Tragic 7.2% |
| Tsimshian | 0.0 /100 | #328 | Tragic 7.2% |
| Alaska Natives | 0.0 /100 | #329 | Tragic 7.2% |
| Yakama | 0.0 /100 | #330 | Tragic 7.3% |
| Dominicans | 0.0 /100 | #331 | Tragic 7.4% |
| Sioux | 0.0 /100 | #332 | Tragic 7.4% |
| Immigrants | Dominican Republic | 0.0 /100 | #333 | Tragic 7.4% |
| Apache | 0.0 /100 | #334 | Tragic 7.4% |
| Alaskan Athabascans | 0.0 /100 | #335 | Tragic 7.7% |
| Immigrants | Yemen | 0.0 /100 | #336 | Tragic 7.7% |