Colville vs South African Male Unemployment
COMPARE
Colville
South African
Male Unemployment
Male Unemployment Comparison
Colville
South Africans
7.4%
MALE UNEMPLOYMENT
0.0/ 100
METRIC RATING
320th/ 347
METRIC RANK
5.0%
MALE UNEMPLOYMENT
96.4/ 100
METRIC RATING
79th/ 347
METRIC RANK
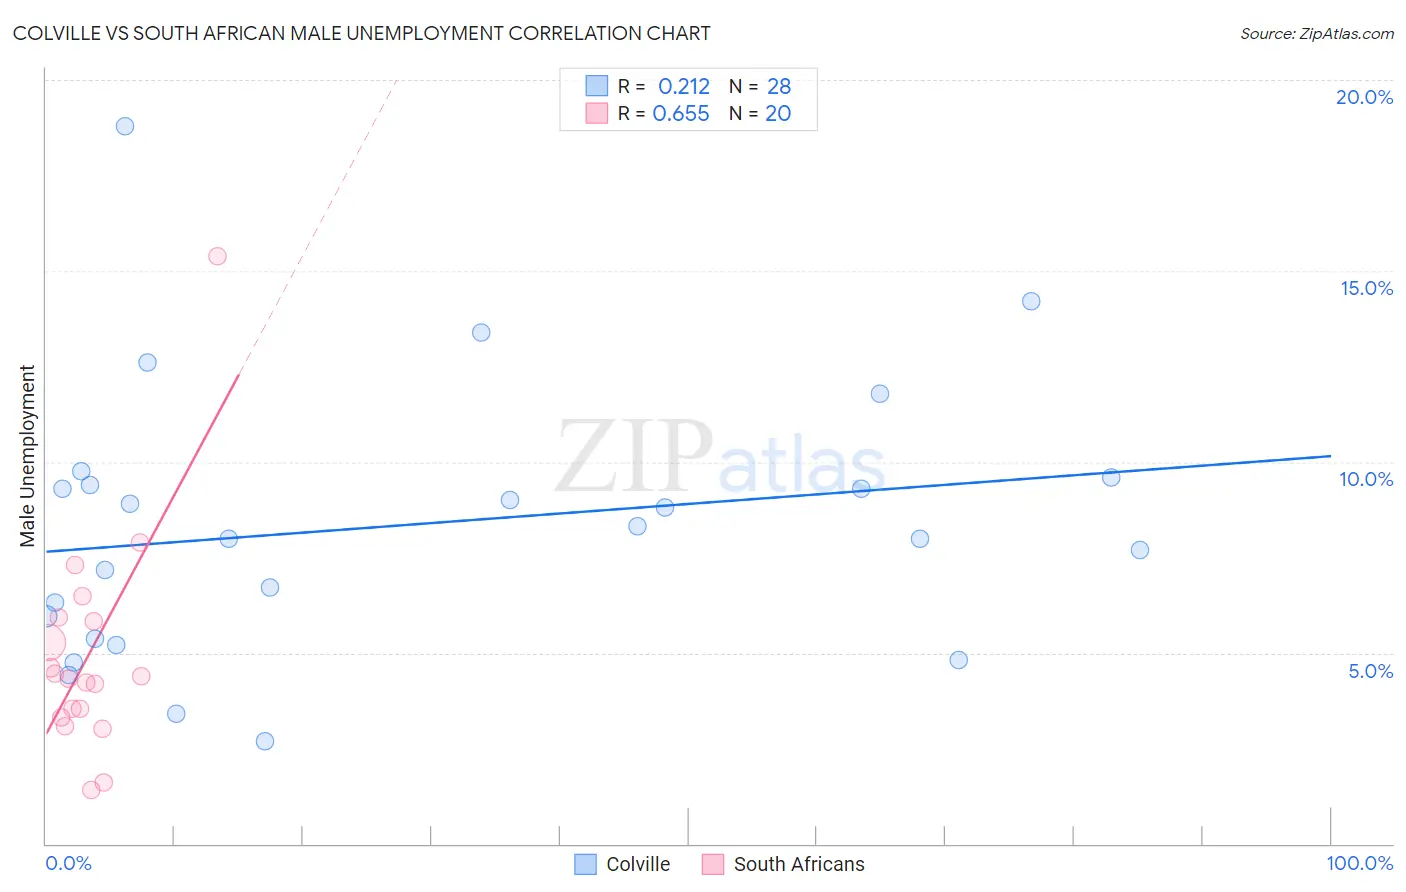
Colville vs South African Male Unemployment Correlation Chart
The statistical analysis conducted on geographies consisting of 34,671,392 people shows a weak positive correlation between the proportion of Colville and unemployment rate among males in the United States with a correlation coefficient (R) of 0.212 and weighted average of 7.4%. Similarly, the statistical analysis conducted on geographies consisting of 182,243,943 people shows a significant positive correlation between the proportion of South Africans and unemployment rate among males in the United States with a correlation coefficient (R) of 0.655 and weighted average of 5.0%, a difference of 46.1%.
Male Unemployment Correlation Summary
| Measurement | Colville | South African |
| Minimum | 2.7% | 1.4% |
| Maximum | 18.8% | 15.4% |
| Range | 16.1% | 14.0% |
| Mean | 8.3% | 5.0% |
| Median | 8.2% | 4.4% |
| Interquartile 25% (IQ1) | 5.7% | 3.4% |
| Interquartile 75% (IQ3) | 9.5% | 5.9% |
| Interquartile Range (IQR) | 3.8% | 2.4% |
| Standard Deviation (Sample) | 3.5% | 3.0% |
| Standard Deviation (Population) | 3.5% | 2.9% |
Similar Demographics by Male Unemployment
Demographics Similar to Colville by Male Unemployment
In terms of male unemployment, the demographic groups most similar to Colville are British West Indian (7.3%, a difference of 0.90%), Immigrants from St. Vincent and the Grenadines (7.5%, a difference of 1.4%), Immigrants from Cabo Verde (7.5%, a difference of 1.7%), Immigrants from Grenada (7.6%, a difference of 2.5%), and Dominican (7.6%, a difference of 2.8%).
| Demographics | Rating | Rank | Male Unemployment |
| Immigrants | Dominica | 0.0 /100 | #313 | Tragic 7.0% |
| Immigrants | Barbados | 0.0 /100 | #314 | Tragic 7.1% |
| Houma | 0.0 /100 | #315 | Tragic 7.1% |
| Immigrants | Guyana | 0.0 /100 | #316 | Tragic 7.1% |
| Guyanese | 0.0 /100 | #317 | Tragic 7.1% |
| Cape Verdeans | 0.0 /100 | #318 | Tragic 7.1% |
| British West Indians | 0.0 /100 | #319 | Tragic 7.3% |
| Colville | 0.0 /100 | #320 | Tragic 7.4% |
| Immigrants | St. Vincent and the Grenadines | 0.0 /100 | #321 | Tragic 7.5% |
| Immigrants | Cabo Verde | 0.0 /100 | #322 | Tragic 7.5% |
| Immigrants | Grenada | 0.0 /100 | #323 | Tragic 7.6% |
| Dominicans | 0.0 /100 | #324 | Tragic 7.6% |
| Shoshone | 0.0 /100 | #325 | Tragic 7.6% |
| Immigrants | Dominican Republic | 0.0 /100 | #326 | Tragic 7.6% |
| Paiute | 0.0 /100 | #327 | Tragic 7.7% |
Demographics Similar to South Africans by Male Unemployment
In terms of male unemployment, the demographic groups most similar to South Africans are Immigrants from Northern Europe (5.0%, a difference of 0.010%), Iranian (5.0%, a difference of 0.020%), Argentinean (5.0%, a difference of 0.050%), French (5.0%, a difference of 0.050%), and Immigrants from Sudan (5.0%, a difference of 0.070%).
| Demographics | Rating | Rank | Male Unemployment |
| Immigrants | South Africa | 97.1 /100 | #72 | Exceptional 5.0% |
| Greeks | 97.0 /100 | #73 | Exceptional 5.0% |
| Immigrants | North America | 96.9 /100 | #74 | Exceptional 5.0% |
| Assyrians/Chaldeans/Syriacs | 96.9 /100 | #75 | Exceptional 5.0% |
| Immigrants | Sudan | 96.5 /100 | #76 | Exceptional 5.0% |
| Iranians | 96.4 /100 | #77 | Exceptional 5.0% |
| Immigrants | Northern Europe | 96.4 /100 | #78 | Exceptional 5.0% |
| South Africans | 96.4 /100 | #79 | Exceptional 5.0% |
| Argentineans | 96.2 /100 | #80 | Exceptional 5.0% |
| French | 96.2 /100 | #81 | Exceptional 5.0% |
| Chileans | 96.2 /100 | #82 | Exceptional 5.0% |
| Immigrants | Eritrea | 96.0 /100 | #83 | Exceptional 5.0% |
| Serbians | 95.7 /100 | #84 | Exceptional 5.1% |
| Immigrants | North Macedonia | 95.6 /100 | #85 | Exceptional 5.1% |
| Maltese | 95.5 /100 | #86 | Exceptional 5.1% |