Uruguayan vs Alaska Native Unemployment Among Women with Children Under 6 years
COMPARE
Uruguayan
Alaska Native
Unemployment Among Women with Children Under 6 years
Unemployment Among Women with Children Under 6 years Comparison
Uruguayans
Alaska Natives
7.5%
UNEMPLOYMENT AMONG WOMEN WITH CHILDREN UNDER 6 YEARS
74.7/ 100
METRIC RATING
153rd/ 347
METRIC RANK
9.6%
UNEMPLOYMENT AMONG WOMEN WITH CHILDREN UNDER 6 YEARS
0.0/ 100
METRIC RATING
322nd/ 347
METRIC RANK
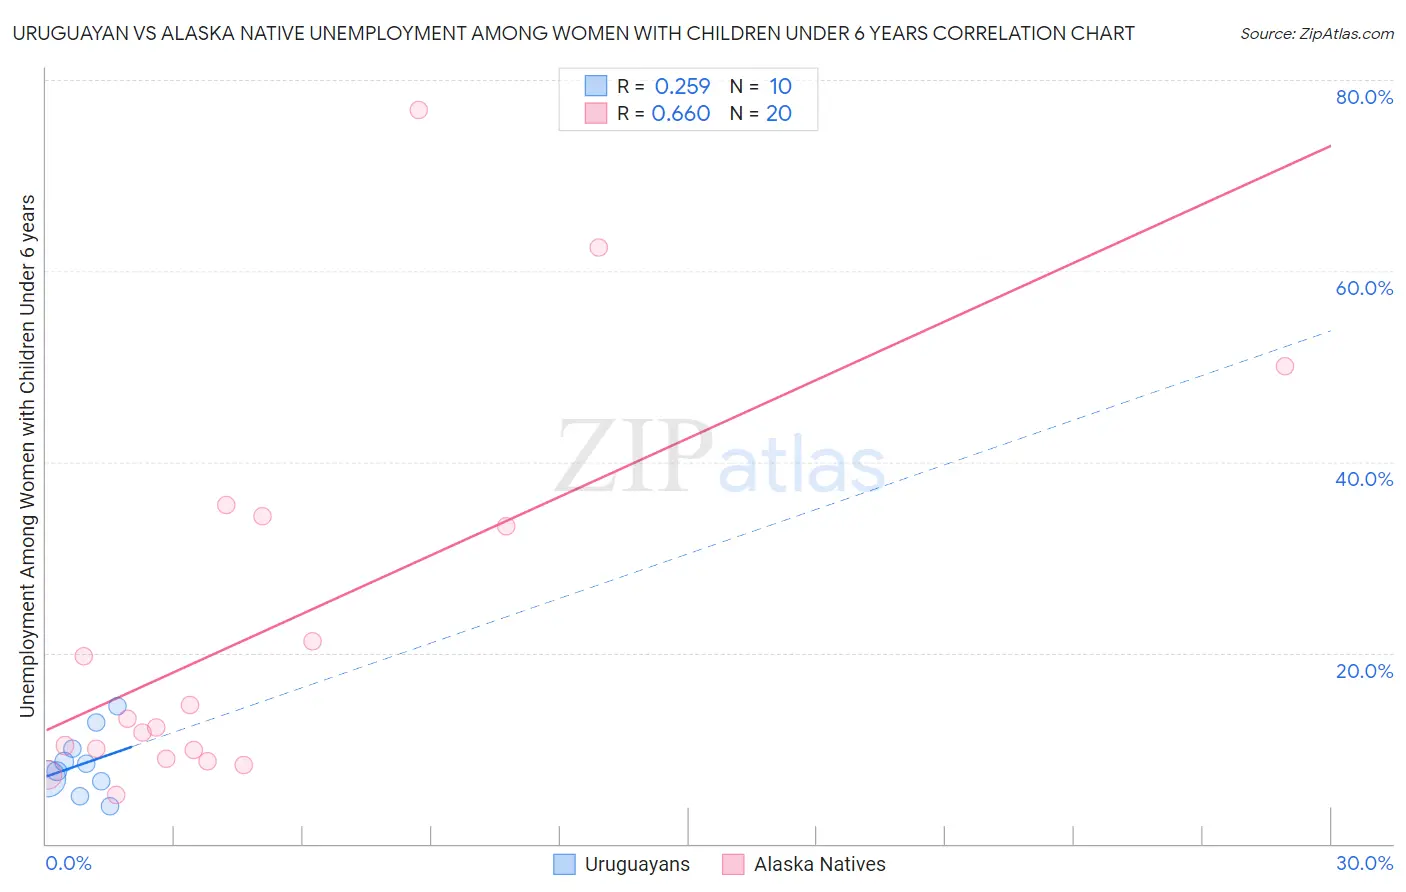
Uruguayan vs Alaska Native Unemployment Among Women with Children Under 6 years Correlation Chart
The statistical analysis conducted on geographies consisting of 126,864,314 people shows a weak positive correlation between the proportion of Uruguayans and unemployment rate among women with children under the age of 6 in the United States with a correlation coefficient (R) of 0.259 and weighted average of 7.5%. Similarly, the statistical analysis conducted on geographies consisting of 70,993,722 people shows a significant positive correlation between the proportion of Alaska Natives and unemployment rate among women with children under the age of 6 in the United States with a correlation coefficient (R) of 0.660 and weighted average of 9.6%, a difference of 28.0%.
Unemployment Among Women with Children Under 6 years Correlation Summary
| Measurement | Uruguayan | Alaska Native |
| Minimum | 4.0% | 5.1% |
| Maximum | 14.4% | 76.9% |
| Range | 10.4% | 71.8% |
| Mean | 8.4% | 22.6% |
| Median | 8.0% | 12.7% |
| Interquartile 25% (IQ1) | 6.5% | 9.4% |
| Interquartile 75% (IQ3) | 10.0% | 33.8% |
| Interquartile Range (IQR) | 3.5% | 24.4% |
| Standard Deviation (Sample) | 3.2% | 20.1% |
| Standard Deviation (Population) | 3.1% | 19.6% |
Similar Demographics by Unemployment Among Women with Children Under 6 years
Demographics Similar to Uruguayans by Unemployment Among Women with Children Under 6 years
In terms of unemployment among women with children under 6 years, the demographic groups most similar to Uruguayans are Bangladeshi (7.5%, a difference of 0.010%), Immigrants from Peru (7.5%, a difference of 0.020%), Northern European (7.5%, a difference of 0.030%), South American (7.5%, a difference of 0.050%), and Colombian (7.5%, a difference of 0.12%).
| Demographics | Rating | Rank | Unemployment Among Women with Children Under 6 years |
| Japanese | 78.9 /100 | #146 | Good 7.5% |
| Immigrants | Oceania | 78.4 /100 | #147 | Good 7.5% |
| Immigrants | Brazil | 77.3 /100 | #148 | Good 7.5% |
| Colombians | 76.1 /100 | #149 | Good 7.5% |
| Aleuts | 76.0 /100 | #150 | Good 7.5% |
| Immigrants | Peru | 74.9 /100 | #151 | Good 7.5% |
| Bangladeshis | 74.8 /100 | #152 | Good 7.5% |
| Uruguayans | 74.7 /100 | #153 | Good 7.5% |
| Northern Europeans | 74.3 /100 | #154 | Good 7.5% |
| South Americans | 74.1 /100 | #155 | Good 7.5% |
| Immigrants | Southern Europe | 73.2 /100 | #156 | Good 7.5% |
| Peruvians | 72.3 /100 | #157 | Good 7.5% |
| Croatians | 71.9 /100 | #158 | Good 7.5% |
| Immigrants | Philippines | 71.3 /100 | #159 | Good 7.5% |
| Bolivians | 70.8 /100 | #160 | Good 7.5% |
Demographics Similar to Alaska Natives by Unemployment Among Women with Children Under 6 years
In terms of unemployment among women with children under 6 years, the demographic groups most similar to Alaska Natives are Immigrants from Bahamas (9.6%, a difference of 0.19%), Central American Indian (9.6%, a difference of 0.25%), Potawatomi (9.6%, a difference of 0.31%), Marshallese (9.6%, a difference of 0.36%), and Paiute (9.7%, a difference of 0.89%).
| Demographics | Rating | Rank | Unemployment Among Women with Children Under 6 years |
| Cherokee | 0.0 /100 | #315 | Tragic 9.3% |
| Houma | 0.0 /100 | #316 | Tragic 9.4% |
| Dutch West Indians | 0.0 /100 | #317 | Tragic 9.5% |
| Osage | 0.0 /100 | #318 | Tragic 9.5% |
| Marshallese | 0.0 /100 | #319 | Tragic 9.6% |
| Potawatomi | 0.0 /100 | #320 | Tragic 9.6% |
| Central American Indians | 0.0 /100 | #321 | Tragic 9.6% |
| Alaska Natives | 0.0 /100 | #322 | Tragic 9.6% |
| Immigrants | Bahamas | 0.0 /100 | #323 | Tragic 9.6% |
| Paiute | 0.0 /100 | #324 | Tragic 9.7% |
| Choctaw | 0.0 /100 | #325 | Tragic 9.8% |
| Delaware | 0.0 /100 | #326 | Tragic 9.8% |
| Ottawa | 0.0 /100 | #327 | Tragic 9.9% |
| Tohono O'odham | 0.0 /100 | #328 | Tragic 10.2% |
| Blacks/African Americans | 0.0 /100 | #329 | Tragic 10.3% |