Belgian vs Alaska Native Unemployment Among Women with Children Under 6 years
COMPARE
Belgian
Alaska Native
Unemployment Among Women with Children Under 6 years
Unemployment Among Women with Children Under 6 years Comparison
Belgians
Alaska Natives
7.6%
UNEMPLOYMENT AMONG WOMEN WITH CHILDREN UNDER 6 YEARS
63.5/ 100
METRIC RATING
166th/ 347
METRIC RANK
9.6%
UNEMPLOYMENT AMONG WOMEN WITH CHILDREN UNDER 6 YEARS
0.0/ 100
METRIC RATING
322nd/ 347
METRIC RANK
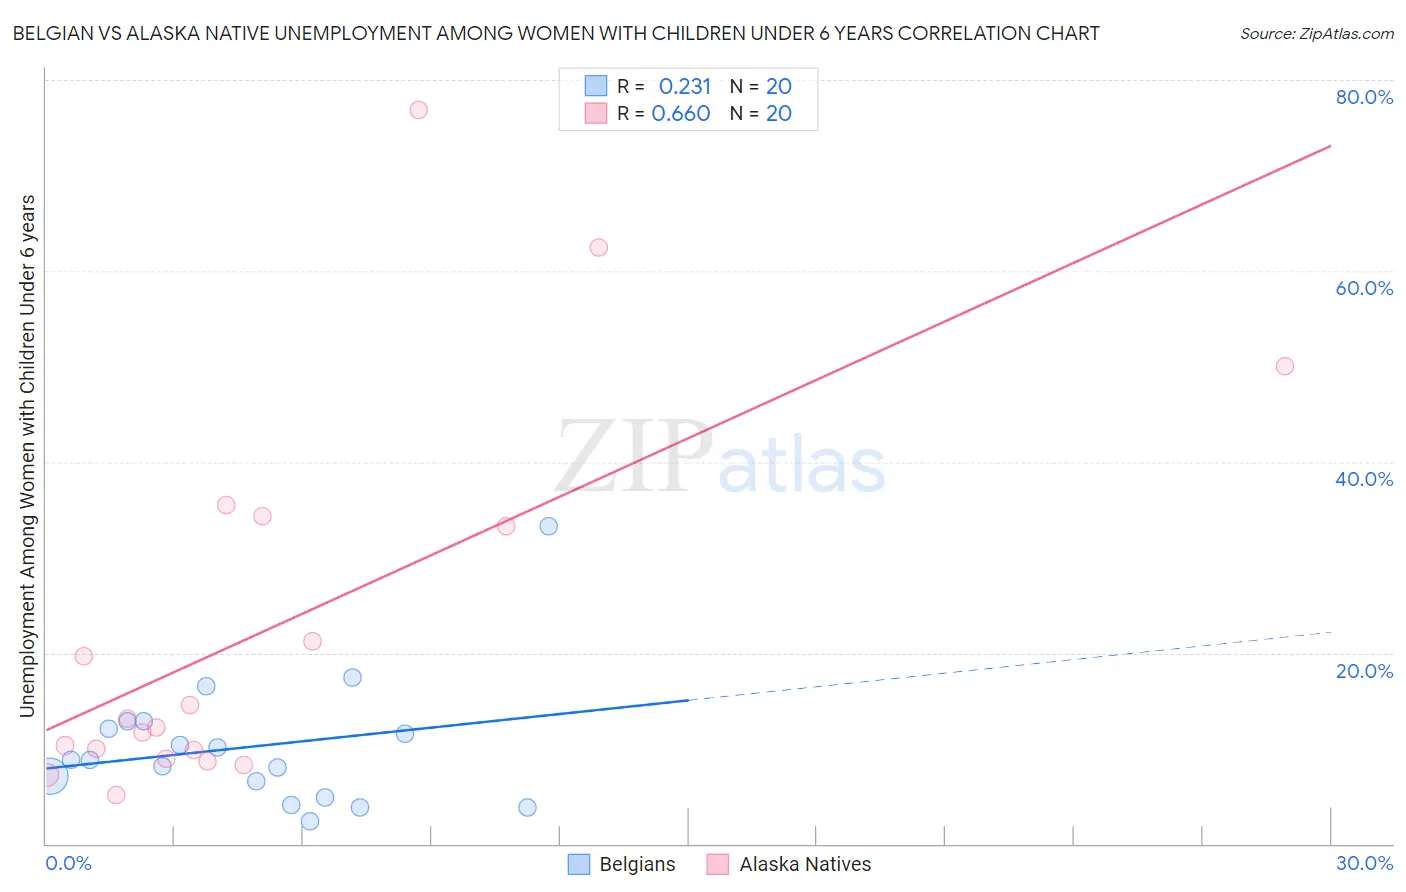
Belgian vs Alaska Native Unemployment Among Women with Children Under 6 years Correlation Chart
The statistical analysis conducted on geographies consisting of 265,159,177 people shows a weak positive correlation between the proportion of Belgians and unemployment rate among women with children under the age of 6 in the United States with a correlation coefficient (R) of 0.231 and weighted average of 7.6%. Similarly, the statistical analysis conducted on geographies consisting of 70,993,722 people shows a significant positive correlation between the proportion of Alaska Natives and unemployment rate among women with children under the age of 6 in the United States with a correlation coefficient (R) of 0.660 and weighted average of 9.6%, a difference of 26.9%.
Unemployment Among Women with Children Under 6 years Correlation Summary
| Measurement | Belgian | Alaska Native |
| Minimum | 2.4% | 5.1% |
| Maximum | 33.3% | 76.9% |
| Range | 30.9% | 71.8% |
| Mean | 10.2% | 22.6% |
| Median | 8.8% | 12.7% |
| Interquartile 25% (IQ1) | 5.7% | 9.4% |
| Interquartile 75% (IQ3) | 12.5% | 33.8% |
| Interquartile Range (IQR) | 6.7% | 24.4% |
| Standard Deviation (Sample) | 6.8% | 20.1% |
| Standard Deviation (Population) | 6.7% | 19.6% |
Similar Demographics by Unemployment Among Women with Children Under 6 years
Demographics Similar to Belgians by Unemployment Among Women with Children Under 6 years
In terms of unemployment among women with children under 6 years, the demographic groups most similar to Belgians are Kenyan (7.6%, a difference of 0.070%), Immigrants from Canada (7.6%, a difference of 0.14%), Immigrants from South America (7.6%, a difference of 0.15%), Immigrants from Scotland (7.6%, a difference of 0.15%), and Ugandan (7.6%, a difference of 0.17%).
| Demographics | Rating | Rank | Unemployment Among Women with Children Under 6 years |
| Immigrants | Philippines | 71.3 /100 | #159 | Good 7.5% |
| Bolivians | 70.8 /100 | #160 | Good 7.5% |
| Immigrants | Western Asia | 70.2 /100 | #161 | Good 7.5% |
| Immigrants | Lithuania | 68.8 /100 | #162 | Good 7.5% |
| British | 66.3 /100 | #163 | Good 7.6% |
| Ugandans | 65.8 /100 | #164 | Good 7.6% |
| Immigrants | South America | 65.6 /100 | #165 | Good 7.6% |
| Belgians | 63.5 /100 | #166 | Good 7.6% |
| Kenyans | 62.5 /100 | #167 | Good 7.6% |
| Immigrants | Canada | 61.6 /100 | #168 | Good 7.6% |
| Immigrants | Scotland | 61.3 /100 | #169 | Good 7.6% |
| Czechs | 59.8 /100 | #170 | Average 7.6% |
| Immigrants | Grenada | 59.0 /100 | #171 | Average 7.6% |
| Immigrants | North America | 57.7 /100 | #172 | Average 7.6% |
| Cree | 51.6 /100 | #173 | Average 7.6% |
Demographics Similar to Alaska Natives by Unemployment Among Women with Children Under 6 years
In terms of unemployment among women with children under 6 years, the demographic groups most similar to Alaska Natives are Immigrants from Bahamas (9.6%, a difference of 0.19%), Central American Indian (9.6%, a difference of 0.25%), Potawatomi (9.6%, a difference of 0.31%), Marshallese (9.6%, a difference of 0.36%), and Paiute (9.7%, a difference of 0.89%).
| Demographics | Rating | Rank | Unemployment Among Women with Children Under 6 years |
| Cherokee | 0.0 /100 | #315 | Tragic 9.3% |
| Houma | 0.0 /100 | #316 | Tragic 9.4% |
| Dutch West Indians | 0.0 /100 | #317 | Tragic 9.5% |
| Osage | 0.0 /100 | #318 | Tragic 9.5% |
| Marshallese | 0.0 /100 | #319 | Tragic 9.6% |
| Potawatomi | 0.0 /100 | #320 | Tragic 9.6% |
| Central American Indians | 0.0 /100 | #321 | Tragic 9.6% |
| Alaska Natives | 0.0 /100 | #322 | Tragic 9.6% |
| Immigrants | Bahamas | 0.0 /100 | #323 | Tragic 9.6% |
| Paiute | 0.0 /100 | #324 | Tragic 9.7% |
| Choctaw | 0.0 /100 | #325 | Tragic 9.8% |
| Delaware | 0.0 /100 | #326 | Tragic 9.8% |
| Ottawa | 0.0 /100 | #327 | Tragic 9.9% |
| Tohono O'odham | 0.0 /100 | #328 | Tragic 10.2% |
| Blacks/African Americans | 0.0 /100 | #329 | Tragic 10.3% |