Taiwanese vs Alaska Native Unemployment Among Women with Children Under 6 years
COMPARE
Taiwanese
Alaska Native
Unemployment Among Women with Children Under 6 years
Unemployment Among Women with Children Under 6 years Comparison
Taiwanese
Alaska Natives
6.1%
UNEMPLOYMENT AMONG WOMEN WITH CHILDREN UNDER 6 YEARS
100.0/ 100
METRIC RATING
7th/ 347
METRIC RANK
9.6%
UNEMPLOYMENT AMONG WOMEN WITH CHILDREN UNDER 6 YEARS
0.0/ 100
METRIC RATING
322nd/ 347
METRIC RANK
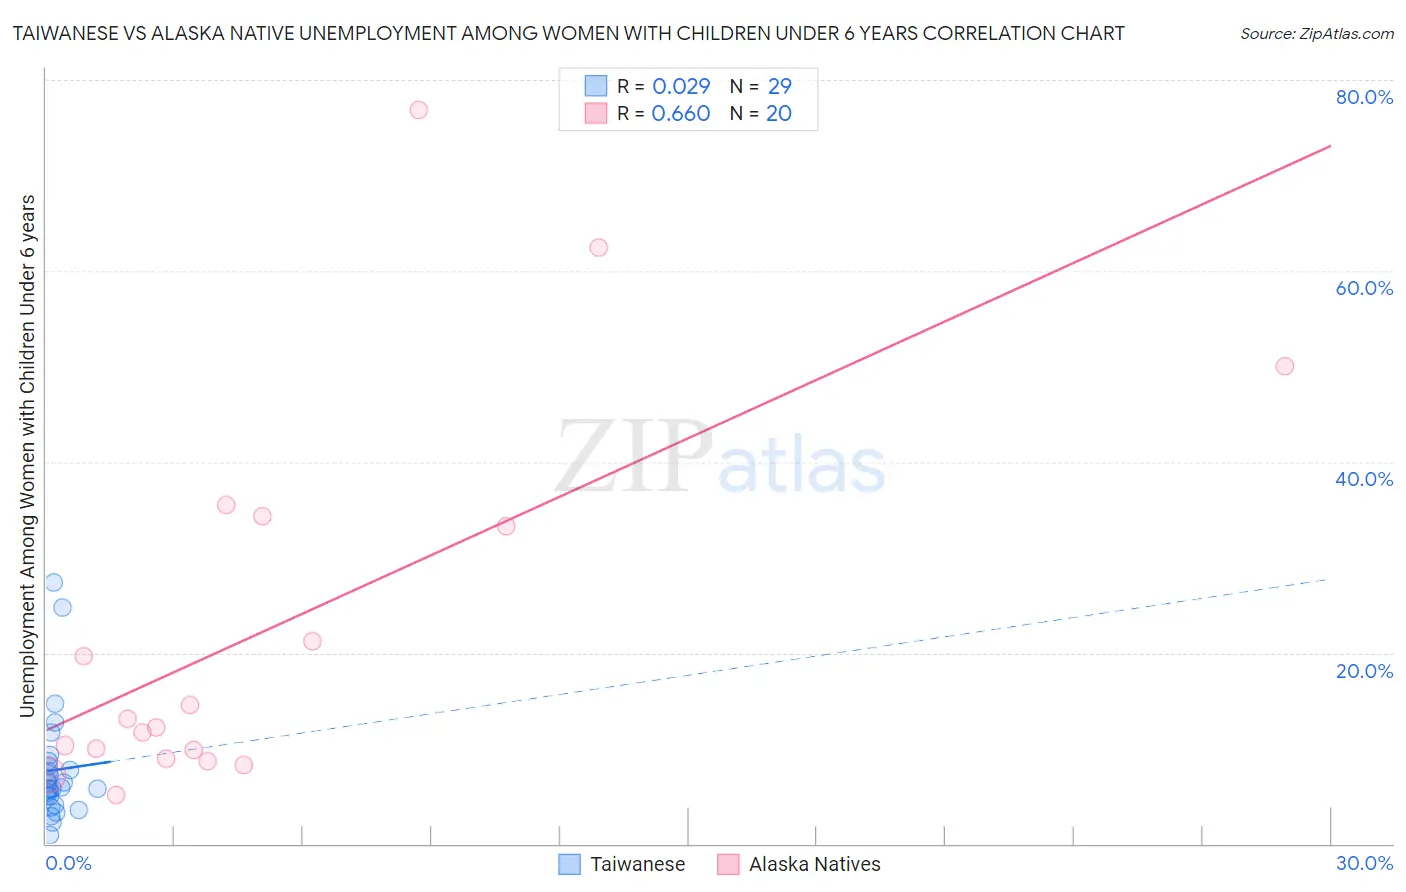
Taiwanese vs Alaska Native Unemployment Among Women with Children Under 6 years Correlation Chart
The statistical analysis conducted on geographies consisting of 30,738,294 people shows no correlation between the proportion of Taiwanese and unemployment rate among women with children under the age of 6 in the United States with a correlation coefficient (R) of 0.029 and weighted average of 6.1%. Similarly, the statistical analysis conducted on geographies consisting of 70,993,722 people shows a significant positive correlation between the proportion of Alaska Natives and unemployment rate among women with children under the age of 6 in the United States with a correlation coefficient (R) of 0.660 and weighted average of 9.6%, a difference of 58.1%.
Unemployment Among Women with Children Under 6 years Correlation Summary
| Measurement | Taiwanese | Alaska Native |
| Minimum | 0.90% | 5.1% |
| Maximum | 27.3% | 76.9% |
| Range | 26.4% | 71.8% |
| Mean | 7.7% | 22.6% |
| Median | 5.9% | 12.7% |
| Interquartile 25% (IQ1) | 4.5% | 9.4% |
| Interquartile 75% (IQ3) | 8.4% | 33.8% |
| Interquartile Range (IQR) | 3.9% | 24.4% |
| Standard Deviation (Sample) | 5.9% | 20.1% |
| Standard Deviation (Population) | 5.8% | 19.6% |
Similar Demographics by Unemployment Among Women with Children Under 6 years
Demographics Similar to Taiwanese by Unemployment Among Women with Children Under 6 years
In terms of unemployment among women with children under 6 years, the demographic groups most similar to Taiwanese are Immigrants from India (6.1%, a difference of 0.49%), Immigrants from Taiwan (6.0%, a difference of 0.52%), Filipino (6.1%, a difference of 0.94%), Cape Verdean (5.9%, a difference of 2.2%), and Immigrants from China (6.2%, a difference of 2.4%).
| Demographics | Rating | Rank | Unemployment Among Women with Children Under 6 years |
| Immigrants | Cabo Verde | 100.0 /100 | #1 | Exceptional 5.4% |
| Immigrants | Hong Kong | 100.0 /100 | #2 | Exceptional 5.8% |
| Okinawans | 100.0 /100 | #3 | Exceptional 5.8% |
| Cambodians | 100.0 /100 | #4 | Exceptional 5.9% |
| Cape Verdeans | 100.0 /100 | #5 | Exceptional 5.9% |
| Immigrants | Taiwan | 100.0 /100 | #6 | Exceptional 6.0% |
| Taiwanese | 100.0 /100 | #7 | Exceptional 6.1% |
| Immigrants | India | 100.0 /100 | #8 | Exceptional 6.1% |
| Filipinos | 100.0 /100 | #9 | Exceptional 6.1% |
| Immigrants | China | 100.0 /100 | #10 | Exceptional 6.2% |
| Indians (Asian) | 100.0 /100 | #11 | Exceptional 6.3% |
| Immigrants | Singapore | 100.0 /100 | #12 | Exceptional 6.3% |
| Immigrants | Eastern Asia | 100.0 /100 | #13 | Exceptional 6.3% |
| Immigrants | Bulgaria | 100.0 /100 | #14 | Exceptional 6.3% |
| Thais | 100.0 /100 | #15 | Exceptional 6.3% |
Demographics Similar to Alaska Natives by Unemployment Among Women with Children Under 6 years
In terms of unemployment among women with children under 6 years, the demographic groups most similar to Alaska Natives are Immigrants from Bahamas (9.6%, a difference of 0.19%), Central American Indian (9.6%, a difference of 0.25%), Potawatomi (9.6%, a difference of 0.31%), Marshallese (9.6%, a difference of 0.36%), and Paiute (9.7%, a difference of 0.89%).
| Demographics | Rating | Rank | Unemployment Among Women with Children Under 6 years |
| Cherokee | 0.0 /100 | #315 | Tragic 9.3% |
| Houma | 0.0 /100 | #316 | Tragic 9.4% |
| Dutch West Indians | 0.0 /100 | #317 | Tragic 9.5% |
| Osage | 0.0 /100 | #318 | Tragic 9.5% |
| Marshallese | 0.0 /100 | #319 | Tragic 9.6% |
| Potawatomi | 0.0 /100 | #320 | Tragic 9.6% |
| Central American Indians | 0.0 /100 | #321 | Tragic 9.6% |
| Alaska Natives | 0.0 /100 | #322 | Tragic 9.6% |
| Immigrants | Bahamas | 0.0 /100 | #323 | Tragic 9.6% |
| Paiute | 0.0 /100 | #324 | Tragic 9.7% |
| Choctaw | 0.0 /100 | #325 | Tragic 9.8% |
| Delaware | 0.0 /100 | #326 | Tragic 9.8% |
| Ottawa | 0.0 /100 | #327 | Tragic 9.9% |
| Tohono O'odham | 0.0 /100 | #328 | Tragic 10.2% |
| Blacks/African Americans | 0.0 /100 | #329 | Tragic 10.3% |