Uruguayan vs Shoshone Unemployment Among Women with Children Under 6 years
COMPARE
Uruguayan
Shoshone
Unemployment Among Women with Children Under 6 years
Unemployment Among Women with Children Under 6 years Comparison
Uruguayans
Shoshone
7.5%
UNEMPLOYMENT AMONG WOMEN WITH CHILDREN UNDER 6 YEARS
74.7/ 100
METRIC RATING
153rd/ 347
METRIC RANK
13.2%
UNEMPLOYMENT AMONG WOMEN WITH CHILDREN UNDER 6 YEARS
0.0/ 100
METRIC RATING
336th/ 347
METRIC RANK
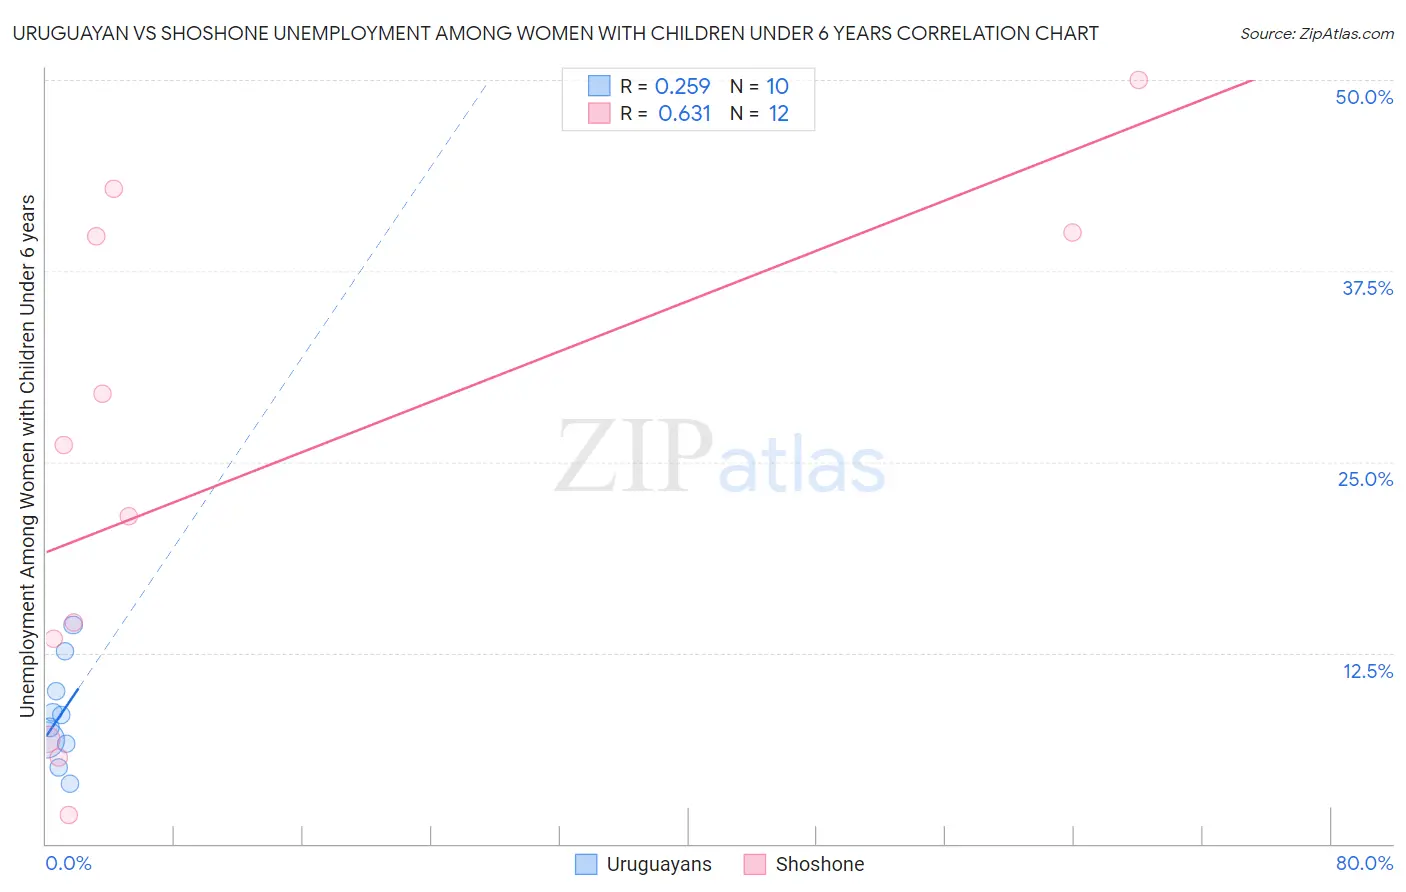
Uruguayan vs Shoshone Unemployment Among Women with Children Under 6 years Correlation Chart
The statistical analysis conducted on geographies consisting of 126,864,314 people shows a weak positive correlation between the proportion of Uruguayans and unemployment rate among women with children under the age of 6 in the United States with a correlation coefficient (R) of 0.259 and weighted average of 7.5%. Similarly, the statistical analysis conducted on geographies consisting of 60,930,865 people shows a significant positive correlation between the proportion of Shoshone and unemployment rate among women with children under the age of 6 in the United States with a correlation coefficient (R) of 0.631 and weighted average of 13.2%, a difference of 75.6%.
Unemployment Among Women with Children Under 6 years Correlation Summary
| Measurement | Uruguayan | Shoshone |
| Minimum | 4.0% | 1.9% |
| Maximum | 14.4% | 50.0% |
| Range | 10.4% | 48.1% |
| Mean | 8.4% | 24.3% |
| Median | 8.0% | 23.8% |
| Interquartile 25% (IQ1) | 6.5% | 10.1% |
| Interquartile 75% (IQ3) | 10.0% | 39.9% |
| Interquartile Range (IQR) | 3.5% | 29.8% |
| Standard Deviation (Sample) | 3.2% | 16.2% |
| Standard Deviation (Population) | 3.1% | 15.5% |
Similar Demographics by Unemployment Among Women with Children Under 6 years
Demographics Similar to Uruguayans by Unemployment Among Women with Children Under 6 years
In terms of unemployment among women with children under 6 years, the demographic groups most similar to Uruguayans are Bangladeshi (7.5%, a difference of 0.010%), Immigrants from Peru (7.5%, a difference of 0.020%), Northern European (7.5%, a difference of 0.030%), South American (7.5%, a difference of 0.050%), and Colombian (7.5%, a difference of 0.12%).
| Demographics | Rating | Rank | Unemployment Among Women with Children Under 6 years |
| Japanese | 78.9 /100 | #146 | Good 7.5% |
| Immigrants | Oceania | 78.4 /100 | #147 | Good 7.5% |
| Immigrants | Brazil | 77.3 /100 | #148 | Good 7.5% |
| Colombians | 76.1 /100 | #149 | Good 7.5% |
| Aleuts | 76.0 /100 | #150 | Good 7.5% |
| Immigrants | Peru | 74.9 /100 | #151 | Good 7.5% |
| Bangladeshis | 74.8 /100 | #152 | Good 7.5% |
| Uruguayans | 74.7 /100 | #153 | Good 7.5% |
| Northern Europeans | 74.3 /100 | #154 | Good 7.5% |
| South Americans | 74.1 /100 | #155 | Good 7.5% |
| Immigrants | Southern Europe | 73.2 /100 | #156 | Good 7.5% |
| Peruvians | 72.3 /100 | #157 | Good 7.5% |
| Croatians | 71.9 /100 | #158 | Good 7.5% |
| Immigrants | Philippines | 71.3 /100 | #159 | Good 7.5% |
| Bolivians | 70.8 /100 | #160 | Good 7.5% |
Demographics Similar to Shoshone by Unemployment Among Women with Children Under 6 years
In terms of unemployment among women with children under 6 years, the demographic groups most similar to Shoshone are Chippewa (13.3%, a difference of 1.1%), Pima (13.4%, a difference of 1.9%), Navajo (13.5%, a difference of 2.3%), Immigrants from Yemen (13.5%, a difference of 2.3%), and Lumbee (13.8%, a difference of 4.6%).
| Demographics | Rating | Rank | Unemployment Among Women with Children Under 6 years |
| Blacks/African Americans | 0.0 /100 | #329 | Tragic 10.3% |
| Pennsylvania Germans | 0.0 /100 | #330 | Tragic 10.8% |
| Colville | 0.0 /100 | #331 | Tragic 11.2% |
| Sioux | 0.0 /100 | #332 | Tragic 11.5% |
| Natives/Alaskans | 0.0 /100 | #333 | Tragic 11.5% |
| Apache | 0.0 /100 | #334 | Tragic 12.3% |
| Puerto Ricans | 0.0 /100 | #335 | Tragic 12.5% |
| Shoshone | 0.0 /100 | #336 | Tragic 13.2% |
| Chippewa | 0.0 /100 | #337 | Tragic 13.3% |
| Pima | 0.0 /100 | #338 | Tragic 13.4% |
| Navajo | 0.0 /100 | #339 | Tragic 13.5% |
| Immigrants | Yemen | 0.0 /100 | #340 | Tragic 13.5% |
| Lumbee | 0.0 /100 | #341 | Tragic 13.8% |
| Yuman | 0.0 /100 | #342 | Tragic 14.6% |
| Crow | 0.0 /100 | #343 | Tragic 14.6% |