Uruguayan vs Sudanese Unemployment Among Women with Children Under 6 years
COMPARE
Uruguayan
Sudanese
Unemployment Among Women with Children Under 6 years
Unemployment Among Women with Children Under 6 years Comparison
Uruguayans
Sudanese
7.5%
UNEMPLOYMENT AMONG WOMEN WITH CHILDREN UNDER 6 YEARS
74.7/ 100
METRIC RATING
153rd/ 347
METRIC RANK
7.8%
UNEMPLOYMENT AMONG WOMEN WITH CHILDREN UNDER 6 YEARS
23.5/ 100
METRIC RATING
202nd/ 347
METRIC RANK
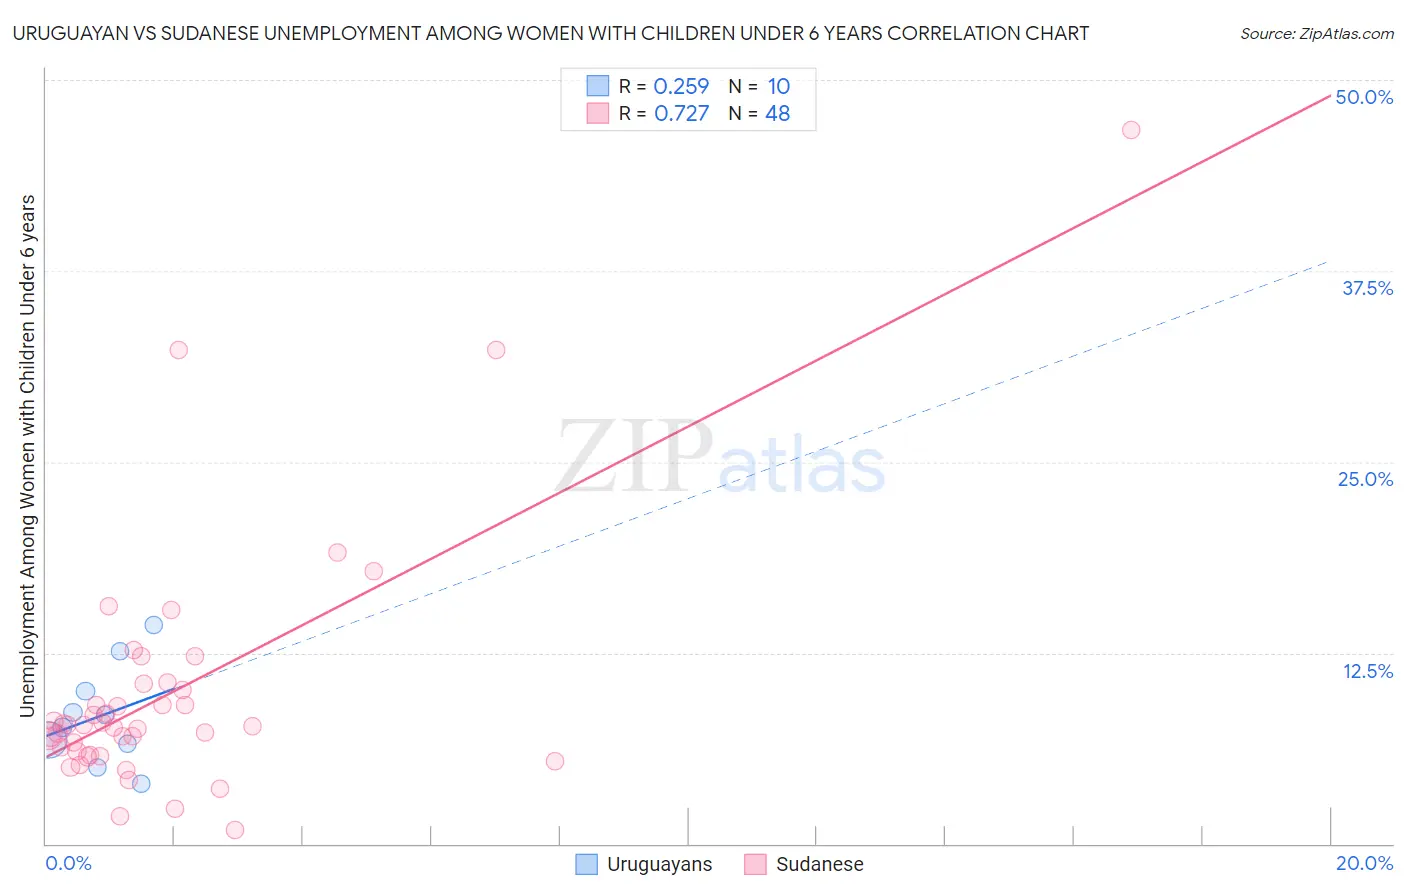
Uruguayan vs Sudanese Unemployment Among Women with Children Under 6 years Correlation Chart
The statistical analysis conducted on geographies consisting of 126,864,314 people shows a weak positive correlation between the proportion of Uruguayans and unemployment rate among women with children under the age of 6 in the United States with a correlation coefficient (R) of 0.259 and weighted average of 7.5%. Similarly, the statistical analysis conducted on geographies consisting of 100,483,224 people shows a strong positive correlation between the proportion of Sudanese and unemployment rate among women with children under the age of 6 in the United States with a correlation coefficient (R) of 0.727 and weighted average of 7.8%, a difference of 3.8%.
Unemployment Among Women with Children Under 6 years Correlation Summary
| Measurement | Uruguayan | Sudanese |
| Minimum | 4.0% | 0.90% |
| Maximum | 14.4% | 46.7% |
| Range | 10.4% | 45.8% |
| Mean | 8.4% | 9.9% |
| Median | 8.0% | 7.7% |
| Interquartile 25% (IQ1) | 6.5% | 6.0% |
| Interquartile 75% (IQ3) | 10.0% | 10.3% |
| Interquartile Range (IQR) | 3.5% | 4.3% |
| Standard Deviation (Sample) | 3.2% | 8.2% |
| Standard Deviation (Population) | 3.1% | 8.1% |
Similar Demographics by Unemployment Among Women with Children Under 6 years
Demographics Similar to Uruguayans by Unemployment Among Women with Children Under 6 years
In terms of unemployment among women with children under 6 years, the demographic groups most similar to Uruguayans are Bangladeshi (7.5%, a difference of 0.010%), Immigrants from Peru (7.5%, a difference of 0.020%), Northern European (7.5%, a difference of 0.030%), South American (7.5%, a difference of 0.050%), and Colombian (7.5%, a difference of 0.12%).
| Demographics | Rating | Rank | Unemployment Among Women with Children Under 6 years |
| Japanese | 78.9 /100 | #146 | Good 7.5% |
| Immigrants | Oceania | 78.4 /100 | #147 | Good 7.5% |
| Immigrants | Brazil | 77.3 /100 | #148 | Good 7.5% |
| Colombians | 76.1 /100 | #149 | Good 7.5% |
| Aleuts | 76.0 /100 | #150 | Good 7.5% |
| Immigrants | Peru | 74.9 /100 | #151 | Good 7.5% |
| Bangladeshis | 74.8 /100 | #152 | Good 7.5% |
| Uruguayans | 74.7 /100 | #153 | Good 7.5% |
| Northern Europeans | 74.3 /100 | #154 | Good 7.5% |
| South Americans | 74.1 /100 | #155 | Good 7.5% |
| Immigrants | Southern Europe | 73.2 /100 | #156 | Good 7.5% |
| Peruvians | 72.3 /100 | #157 | Good 7.5% |
| Croatians | 71.9 /100 | #158 | Good 7.5% |
| Immigrants | Philippines | 71.3 /100 | #159 | Good 7.5% |
| Bolivians | 70.8 /100 | #160 | Good 7.5% |
Demographics Similar to Sudanese by Unemployment Among Women with Children Under 6 years
In terms of unemployment among women with children under 6 years, the demographic groups most similar to Sudanese are Spaniard (7.8%, a difference of 0.010%), Basque (7.8%, a difference of 0.11%), Lebanese (7.8%, a difference of 0.12%), Guamanian/Chamorro (7.8%, a difference of 0.18%), and Immigrants (7.8%, a difference of 0.20%).
| Demographics | Rating | Rank | Unemployment Among Women with Children Under 6 years |
| Malaysians | 31.1 /100 | #195 | Fair 7.7% |
| Immigrants | St. Vincent and the Grenadines | 31.1 /100 | #196 | Fair 7.7% |
| Italians | 30.4 /100 | #197 | Fair 7.7% |
| Lithuanians | 30.0 /100 | #198 | Fair 7.8% |
| Immigrants | Poland | 27.3 /100 | #199 | Fair 7.8% |
| Guamanians/Chamorros | 25.5 /100 | #200 | Fair 7.8% |
| Basques | 24.7 /100 | #201 | Fair 7.8% |
| Sudanese | 23.5 /100 | #202 | Fair 7.8% |
| Spaniards | 23.3 /100 | #203 | Fair 7.8% |
| Lebanese | 22.2 /100 | #204 | Fair 7.8% |
| Immigrants | Immigrants | 21.4 /100 | #205 | Fair 7.8% |
| Hungarians | 21.2 /100 | #206 | Fair 7.8% |
| Canadians | 20.6 /100 | #207 | Fair 7.8% |
| Immigrants | Syria | 18.9 /100 | #208 | Poor 7.8% |
| Costa Ricans | 17.6 /100 | #209 | Poor 7.8% |