Ugandan vs Israeli Unemployment
COMPARE
Ugandan
Israeli
Unemployment
Unemployment Comparison
Ugandans
Israelis
5.4%
UNEMPLOYMENT
18.0/ 100
METRIC RATING
212th/ 347
METRIC RANK
5.4%
UNEMPLOYMENT
8.8/ 100
METRIC RATING
224th/ 347
METRIC RANK
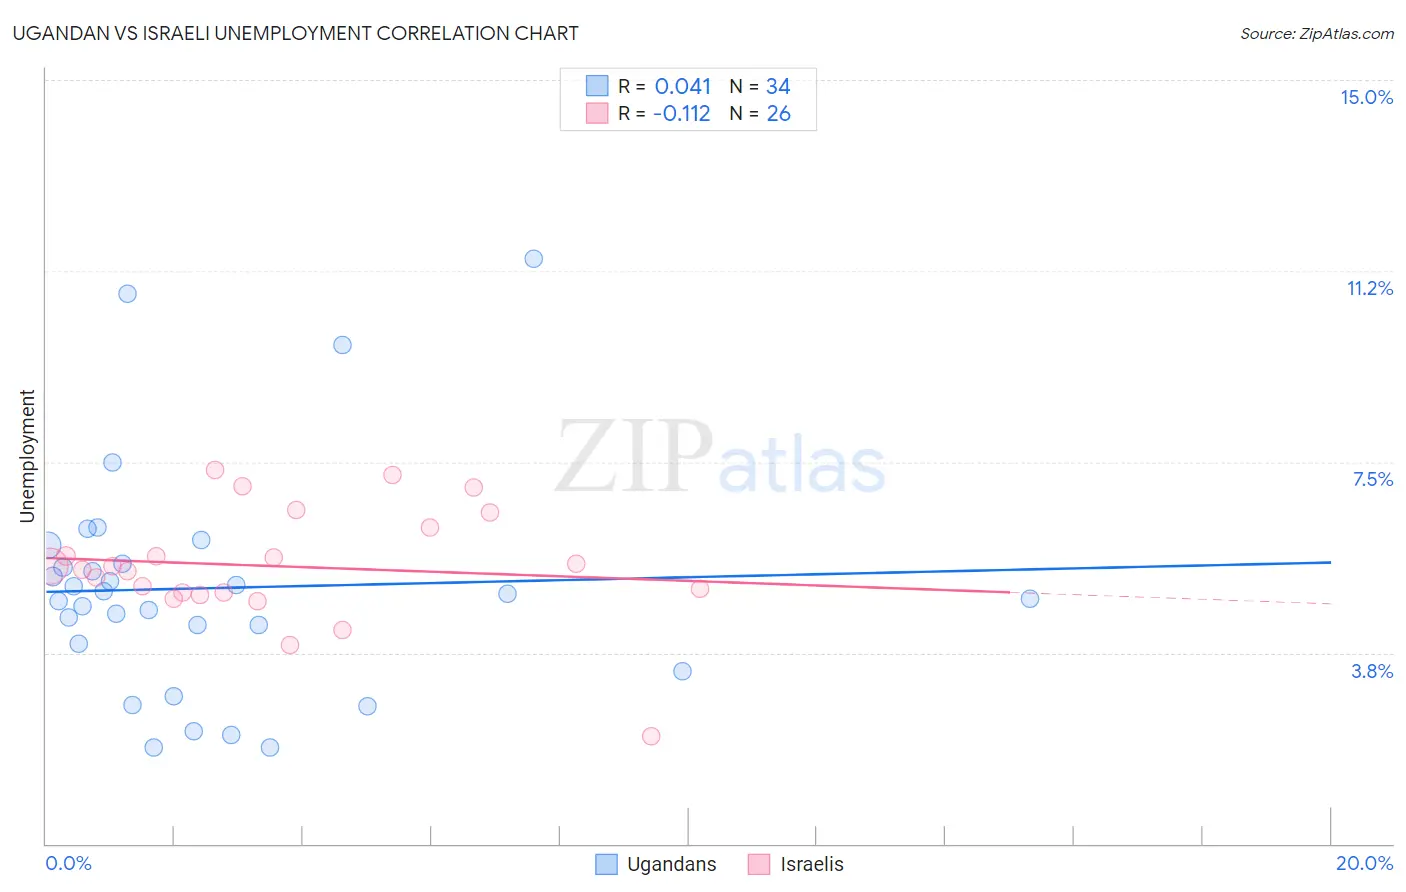
Ugandan vs Israeli Unemployment Correlation Chart
The statistical analysis conducted on geographies consisting of 94,004,444 people shows no correlation between the proportion of Ugandans and unemployment in the United States with a correlation coefficient (R) of 0.041 and weighted average of 5.4%. Similarly, the statistical analysis conducted on geographies consisting of 211,104,843 people shows a poor negative correlation between the proportion of Israelis and unemployment in the United States with a correlation coefficient (R) of -0.112 and weighted average of 5.4%, a difference of 1.2%.
Unemployment Correlation Summary
| Measurement | Ugandan | Israeli |
| Minimum | 1.9% | 2.1% |
| Maximum | 11.5% | 7.3% |
| Range | 9.6% | 5.2% |
| Mean | 5.0% | 5.4% |
| Median | 4.8% | 5.4% |
| Interquartile 25% (IQ1) | 3.9% | 4.9% |
| Interquartile 75% (IQ3) | 5.5% | 6.2% |
| Interquartile Range (IQR) | 1.6% | 1.3% |
| Standard Deviation (Sample) | 2.2% | 1.1% |
| Standard Deviation (Population) | 2.2% | 1.1% |
Demographics Similar to Ugandans and Israelis by Unemployment
In terms of unemployment, the demographic groups most similar to Ugandans are Iraqi (5.4%, a difference of 0.010%), Immigrants from Iraq (5.4%, a difference of 0.060%), Immigrants from Iran (5.4%, a difference of 0.080%), Portuguese (5.4%, a difference of 0.11%), and Immigrants from Middle Africa (5.4%, a difference of 0.29%). Similarly, the demographic groups most similar to Israelis are Seminole (5.4%, a difference of 0.070%), South American Indian (5.5%, a difference of 0.20%), Iroquois (5.4%, a difference of 0.25%), Immigrants from Philippines (5.4%, a difference of 0.28%), and Soviet Union (5.4%, a difference of 0.31%).
| Demographics | Rating | Rank | Unemployment |
| Portuguese | 19.0 /100 | #208 | Poor 5.4% |
| Immigrants | Iran | 18.8 /100 | #209 | Poor 5.4% |
| Immigrants | Iraq | 18.6 /100 | #210 | Poor 5.4% |
| Iraqis | 18.1 /100 | #211 | Poor 5.4% |
| Ugandans | 18.0 /100 | #212 | Poor 5.4% |
| Immigrants | Middle Africa | 15.3 /100 | #213 | Poor 5.4% |
| Immigrants | Costa Rica | 15.2 /100 | #214 | Poor 5.4% |
| Delaware | 14.7 /100 | #215 | Poor 5.4% |
| Immigrants | South America | 13.5 /100 | #216 | Poor 5.4% |
| Immigrants | Albania | 13.5 /100 | #217 | Poor 5.4% |
| Choctaw | 12.7 /100 | #218 | Poor 5.4% |
| Bangladeshis | 11.2 /100 | #219 | Poor 5.4% |
| Soviet Union | 10.6 /100 | #220 | Poor 5.4% |
| Immigrants | Philippines | 10.4 /100 | #221 | Poor 5.4% |
| Iroquois | 10.3 /100 | #222 | Poor 5.4% |
| Seminole | 9.2 /100 | #223 | Tragic 5.4% |
| Israelis | 8.8 /100 | #224 | Tragic 5.4% |
| South American Indians | 7.8 /100 | #225 | Tragic 5.5% |
| Samoans | 7.1 /100 | #226 | Tragic 5.5% |
| Immigrants | Lebanon | 7.0 /100 | #227 | Tragic 5.5% |
| Guamanians/Chamorros | 6.3 /100 | #228 | Tragic 5.5% |