Ugandan vs Immigrants from Canada Unemployment
COMPARE
Ugandan
Immigrants from Canada
Unemployment
Unemployment Comparison
Ugandans
Immigrants from Canada
5.4%
UNEMPLOYMENT
18.0/ 100
METRIC RATING
212th/ 347
METRIC RANK
4.9%
UNEMPLOYMENT
98.8/ 100
METRIC RATING
65th/ 347
METRIC RANK
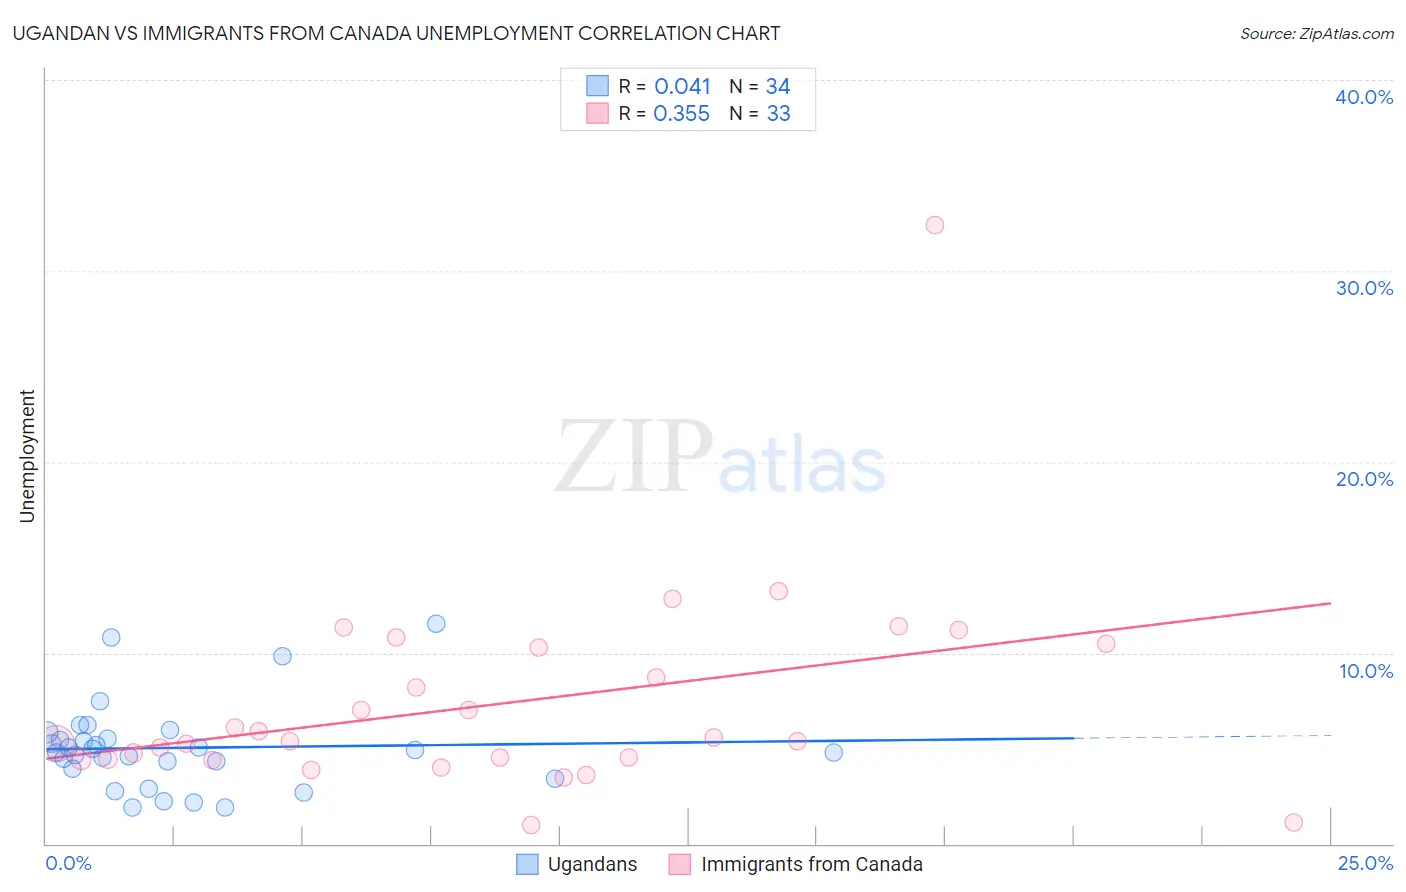
Ugandan vs Immigrants from Canada Unemployment Correlation Chart
The statistical analysis conducted on geographies consisting of 94,004,444 people shows no correlation between the proportion of Ugandans and unemployment in the United States with a correlation coefficient (R) of 0.041 and weighted average of 5.4%. Similarly, the statistical analysis conducted on geographies consisting of 458,510,369 people shows a mild positive correlation between the proportion of Immigrants from Canada and unemployment in the United States with a correlation coefficient (R) of 0.355 and weighted average of 4.9%, a difference of 9.7%.
Unemployment Correlation Summary
| Measurement | Ugandan | Immigrants from Canada |
| Minimum | 1.9% | 1.0% |
| Maximum | 11.5% | 32.4% |
| Range | 9.6% | 31.4% |
| Mean | 5.0% | 7.4% |
| Median | 4.8% | 5.4% |
| Interquartile 25% (IQ1) | 3.9% | 4.4% |
| Interquartile 75% (IQ3) | 5.5% | 10.4% |
| Interquartile Range (IQR) | 1.6% | 5.9% |
| Standard Deviation (Sample) | 2.2% | 5.5% |
| Standard Deviation (Population) | 2.2% | 5.5% |
Similar Demographics by Unemployment
Demographics Similar to Ugandans by Unemployment
In terms of unemployment, the demographic groups most similar to Ugandans are Iraqi (5.4%, a difference of 0.010%), Immigrants from Iraq (5.4%, a difference of 0.060%), Immigrants from Iran (5.4%, a difference of 0.080%), Portuguese (5.4%, a difference of 0.11%), and Creek (5.4%, a difference of 0.14%).
| Demographics | Rating | Rank | Unemployment |
| Native Hawaiians | 24.1 /100 | #205 | Fair 5.3% |
| Immigrants | Peru | 22.7 /100 | #206 | Fair 5.4% |
| Creek | 19.4 /100 | #207 | Poor 5.4% |
| Portuguese | 19.0 /100 | #208 | Poor 5.4% |
| Immigrants | Iran | 18.8 /100 | #209 | Poor 5.4% |
| Immigrants | Iraq | 18.6 /100 | #210 | Poor 5.4% |
| Iraqis | 18.1 /100 | #211 | Poor 5.4% |
| Ugandans | 18.0 /100 | #212 | Poor 5.4% |
| Immigrants | Middle Africa | 15.3 /100 | #213 | Poor 5.4% |
| Immigrants | Costa Rica | 15.2 /100 | #214 | Poor 5.4% |
| Delaware | 14.7 /100 | #215 | Poor 5.4% |
| Immigrants | South America | 13.5 /100 | #216 | Poor 5.4% |
| Immigrants | Albania | 13.5 /100 | #217 | Poor 5.4% |
| Choctaw | 12.7 /100 | #218 | Poor 5.4% |
| Bangladeshis | 11.2 /100 | #219 | Poor 5.4% |
Demographics Similar to Immigrants from Canada by Unemployment
In terms of unemployment, the demographic groups most similar to Immigrants from Canada are Italian (4.9%, a difference of 0.14%), Slovak (4.9%, a difference of 0.15%), New Zealander (4.9%, a difference of 0.19%), Slavic (4.9%, a difference of 0.22%), and Immigrants from Bulgaria (4.9%, a difference of 0.23%).
| Demographics | Rating | Rank | Unemployment |
| Greeks | 99.0 /100 | #58 | Exceptional 4.9% |
| Bhutanese | 99.0 /100 | #59 | Exceptional 4.9% |
| Immigrants | Netherlands | 99.0 /100 | #60 | Exceptional 4.9% |
| Cambodians | 99.0 /100 | #61 | Exceptional 4.9% |
| Icelanders | 98.9 /100 | #62 | Exceptional 4.9% |
| Immigrants | Bulgaria | 98.9 /100 | #63 | Exceptional 4.9% |
| Italians | 98.9 /100 | #64 | Exceptional 4.9% |
| Immigrants | Canada | 98.8 /100 | #65 | Exceptional 4.9% |
| Slovaks | 98.7 /100 | #66 | Exceptional 4.9% |
| New Zealanders | 98.6 /100 | #67 | Exceptional 4.9% |
| Slavs | 98.6 /100 | #68 | Exceptional 4.9% |
| Immigrants | North America | 98.5 /100 | #69 | Exceptional 4.9% |
| Serbians | 98.4 /100 | #70 | Exceptional 4.9% |
| Immigrants | Japan | 98.3 /100 | #71 | Exceptional 4.9% |
| Burmese | 98.3 /100 | #72 | Exceptional 4.9% |