Turkish vs Lebanese Unemployment Among Women with Children Under 6 years
COMPARE
Turkish
Lebanese
Unemployment Among Women with Children Under 6 years
Unemployment Among Women with Children Under 6 years Comparison
Turks
Lebanese
7.0%
UNEMPLOYMENT AMONG WOMEN WITH CHILDREN UNDER 6 YEARS
99.2/ 100
METRIC RATING
74th/ 347
METRIC RANK
7.8%
UNEMPLOYMENT AMONG WOMEN WITH CHILDREN UNDER 6 YEARS
22.2/ 100
METRIC RATING
204th/ 347
METRIC RANK
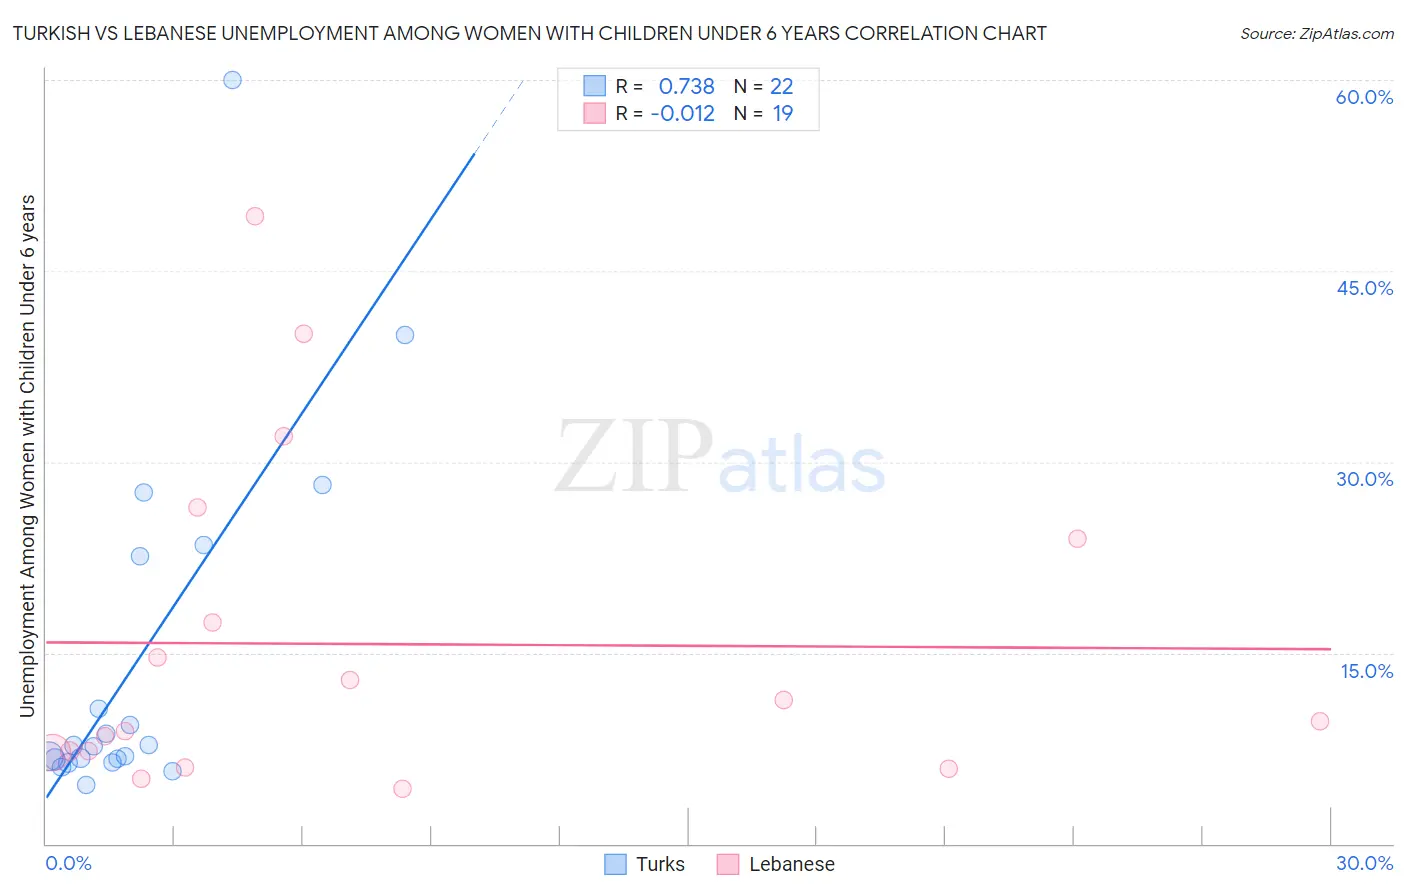
Turkish vs Lebanese Unemployment Among Women with Children Under 6 years Correlation Chart
The statistical analysis conducted on geographies consisting of 219,764,110 people shows a strong positive correlation between the proportion of Turks and unemployment rate among women with children under the age of 6 in the United States with a correlation coefficient (R) of 0.738 and weighted average of 7.0%. Similarly, the statistical analysis conducted on geographies consisting of 301,337,117 people shows no correlation between the proportion of Lebanese and unemployment rate among women with children under the age of 6 in the United States with a correlation coefficient (R) of -0.012 and weighted average of 7.8%, a difference of 10.9%.
Unemployment Among Women with Children Under 6 years Correlation Summary
| Measurement | Turkish | Lebanese |
| Minimum | 4.6% | 4.3% |
| Maximum | 60.0% | 49.3% |
| Range | 55.4% | 45.0% |
| Mean | 14.4% | 15.7% |
| Median | 7.7% | 9.6% |
| Interquartile 25% (IQ1) | 6.6% | 7.2% |
| Interquartile 75% (IQ3) | 22.6% | 24.0% |
| Interquartile Range (IQR) | 16.0% | 16.8% |
| Standard Deviation (Sample) | 14.0% | 12.9% |
| Standard Deviation (Population) | 13.7% | 12.5% |
Similar Demographics by Unemployment Among Women with Children Under 6 years
Demographics Similar to Turks by Unemployment Among Women with Children Under 6 years
In terms of unemployment among women with children under 6 years, the demographic groups most similar to Turks are Immigrants from Czechoslovakia (7.0%, a difference of 0.010%), Immigrants from Eastern Europe (7.1%, a difference of 0.40%), Estonian (7.1%, a difference of 0.45%), Immigrants from Croatia (7.1%, a difference of 0.48%), and Immigrants from Somalia (7.1%, a difference of 0.52%).
| Demographics | Rating | Rank | Unemployment Among Women with Children Under 6 years |
| Immigrants | Netherlands | 99.5 /100 | #67 | Exceptional 7.0% |
| Paraguayans | 99.4 /100 | #68 | Exceptional 7.0% |
| Immigrants | Eritrea | 99.4 /100 | #69 | Exceptional 7.0% |
| Immigrants | Iraq | 99.4 /100 | #70 | Exceptional 7.0% |
| Afghans | 99.4 /100 | #71 | Exceptional 7.0% |
| Cubans | 99.4 /100 | #72 | Exceptional 7.0% |
| Immigrants | Czechoslovakia | 99.2 /100 | #73 | Exceptional 7.0% |
| Turks | 99.2 /100 | #74 | Exceptional 7.0% |
| Immigrants | Eastern Europe | 99.0 /100 | #75 | Exceptional 7.1% |
| Estonians | 99.0 /100 | #76 | Exceptional 7.1% |
| Immigrants | Croatia | 98.9 /100 | #77 | Exceptional 7.1% |
| Immigrants | Somalia | 98.9 /100 | #78 | Exceptional 7.1% |
| Immigrants | Fiji | 98.9 /100 | #79 | Exceptional 7.1% |
| Immigrants | Greece | 98.9 /100 | #80 | Exceptional 7.1% |
| Immigrants | Venezuela | 98.8 /100 | #81 | Exceptional 7.1% |
Demographics Similar to Lebanese by Unemployment Among Women with Children Under 6 years
In terms of unemployment among women with children under 6 years, the demographic groups most similar to Lebanese are Immigrants (7.8%, a difference of 0.080%), Hungarian (7.8%, a difference of 0.10%), Spaniard (7.8%, a difference of 0.11%), Sudanese (7.8%, a difference of 0.12%), and Canadian (7.8%, a difference of 0.15%).
| Demographics | Rating | Rank | Unemployment Among Women with Children Under 6 years |
| Italians | 30.4 /100 | #197 | Fair 7.7% |
| Lithuanians | 30.0 /100 | #198 | Fair 7.8% |
| Immigrants | Poland | 27.3 /100 | #199 | Fair 7.8% |
| Guamanians/Chamorros | 25.5 /100 | #200 | Fair 7.8% |
| Basques | 24.7 /100 | #201 | Fair 7.8% |
| Sudanese | 23.5 /100 | #202 | Fair 7.8% |
| Spaniards | 23.3 /100 | #203 | Fair 7.8% |
| Lebanese | 22.2 /100 | #204 | Fair 7.8% |
| Immigrants | Immigrants | 21.4 /100 | #205 | Fair 7.8% |
| Hungarians | 21.2 /100 | #206 | Fair 7.8% |
| Canadians | 20.6 /100 | #207 | Fair 7.8% |
| Immigrants | Syria | 18.9 /100 | #208 | Poor 7.8% |
| Costa Ricans | 17.6 /100 | #209 | Poor 7.8% |
| Poles | 16.0 /100 | #210 | Poor 7.9% |
| Immigrants | Ecuador | 14.9 /100 | #211 | Poor 7.9% |