Egyptian vs Irish Female Unemployment

COMPARE

Egyptian
Race
Ancestry
AfghanAfricanAlaska NativeAlaskan AthabascanAlbanianAleutAlsatianAmericanApacheArabArapahoArgentineanArmenianAssyrian/Chaldean/SyriacAustralianAustrianBahamianBangladeshiBarbadianBasqueBelgianBelizeanBermudanBhutaneseBlackfeetBolivianBrazilianBritishBritish West IndianBulgarianBurmeseCajunCambodianCanadianCape VerdeanCarpatho RusynCelticCentral AmericanCentral American IndianCherokeeCheyenneChickasawChileanChineseChippewaChoctawColombianColvilleComancheCosta RicanCreeCreekCroatianCrowCubanCypriotCzechCzechoslovakianDanishDelawareDominicanDutchDutch West IndianEastern EuropeanEcuadorianEgyptianEnglishEstonianEthiopianEuropeanFijianFilipinoFinnishFrenchFrench American IndianFrench CanadianGermanGerman RussianGhanaianGreekGuamanian/ChamorroGuatemalanGuyaneseHaitianHmongHonduranHopiHoumaHungarianIcelanderIndian (Asian)IndonesianInupiatIranianIraqiIroquoisIsraeliItalianJamaicanJapaneseJordanianKenyanKiowaKoreanLaotianLatvianLebaneseLiberianLithuanianLumbeeLuxembourgerMacedonianMalaysianMalteseMarshalleseMenomineeMexicanMexican American IndianMongolianMoroccanNative HawaiianNavajoNepaleseNew ZealanderNicaraguanNigerianNorthern EuropeanNorwegianOkinawanOsageOttawaPaiutePakistaniPalestinianPanamanianParaguayanPennsylvania GermanPeruvianPimaPolishPortuguesePotawatomiPuebloPuerto RicanPuget Sound SalishRomanianRussianSalvadoranSamoanScandinavianScotch-IrishScottishSeminoleSenegaleseSerbianShoshoneSierra LeoneanSiouxSlavicSlovakSloveneSomaliSouth AfricanSouth AmericanSouth American IndianSoviet UnionSpaniardSpanishSpanish AmericanSpanish American IndianSri LankanSubsaharan AfricanSudaneseSwedishSwissSyrianTaiwaneseThaiTlingit-HaidaTohono O'OdhamTonganTrinidadian and TobagonianTsimshianTurkishU.S. Virgin IslanderUgandanUkrainianUruguayanUteVenezuelanVietnameseWelshWest IndianYakamaYaquiYugoslavianYumanYup'ikZimbabwean
Immigration
NonimmigrantsImmigrantsAfghanistanAfricaAlbaniaArgentinaArmeniaAsiaAustraliaAustriaBahamasBangladeshBarbadosBelarusBelgiumBelizeBoliviaBosnia and HerzegovinaBrazilBulgariaBurma/MyanmarCabo VerdeCambodiaCameroonCanadaCaribbeanCentral AmericaChileChinaColombiaCongoCosta RicaCroatiaCubaCzechoslovakiaDenmarkDominicaDominican RepublicEastern AfricaEastern AsiaEastern EuropeEcuadorEgyptEl SalvadorEnglandEritreaEthiopiaEuropeFijiFranceGermanyGhanaGreeceGrenadaGuatemalaGuyanaHaitiHondurasHong KongHungaryIndiaIndonesiaIranIraqIrelandIsraelItalyJamaicaJapanJordanKazakhstanKenyaKoreaKuwaitLaosLatin AmericaLatviaLebanonLiberiaLithuaniaMalaysiaMexicoMicronesiaMiddle AfricaMoldovaMoroccoNepalNetherlandsNicaraguaNigeriaNorth AmericaNorth MacedoniaNorthern AfricaNorthern EuropeNorwayOceaniaPakistanPanamaPeruPhilippinesPolandPortugalRomaniaRussiaSaudi ArabiaScotlandSenegalSerbiaSierra LeoneSingaporeSomaliaSouth AfricaSouth AmericaSouth Central AsiaSouth Eastern AsiaSouthern EuropeSpainSri LankaSt. Vincent and the GrenadinesSudanSwedenSwitzerlandSyriaTaiwanThailandTrinidad and TobagoTurkeyUgandaUkraineUruguayUzbekistanVenezuelaVietnamWest IndiesWestern AfricaWestern AsiaWestern EuropeYemenZaireZimbabweAzores
Irish
Race
Ancestry
AfghanAfricanAlaska NativeAlaskan AthabascanAlbanianAleutAlsatianAmericanApacheArabArapahoArgentineanArmenianAssyrian/Chaldean/SyriacAustralianAustrianBahamianBangladeshiBarbadianBasqueBelgianBelizeanBermudanBhutaneseBlackfeetBolivianBrazilianBritishBritish West IndianBulgarianBurmeseCajunCambodianCanadianCape VerdeanCarpatho RusynCelticCentral AmericanCentral American IndianCherokeeCheyenneChickasawChileanChineseChippewaChoctawColombianColvilleComancheCosta RicanCreeCreekCroatianCrowCubanCypriotCzechCzechoslovakianDanishDelawareDominicanDutchDutch West IndianEastern EuropeanEcuadorianEnglishEstonianEthiopianEuropeanFijianFilipinoFinnishFrenchFrench American IndianFrench CanadianGermanGerman RussianGhanaianGreekGuamanian/ChamorroGuatemalanGuyaneseHaitianHmongHonduranHopiHoumaHungarianIcelanderIndian (Asian)IndonesianInupiatIranianIraqiIrishIroquoisIsraeliItalianJamaicanJapaneseJordanianKenyanKiowaKoreanLaotianLatvianLebaneseLiberianLithuanianLumbeeLuxembourgerMacedonianMalaysianMalteseMarshalleseMenomineeMexicanMexican American IndianMongolianMoroccanNative HawaiianNavajoNepaleseNew ZealanderNicaraguanNigerianNorthern EuropeanNorwegianOkinawanOsageOttawaPaiutePakistaniPalestinianPanamanianParaguayanPennsylvania GermanPeruvianPimaPolishPortuguesePotawatomiPuebloPuerto RicanPuget Sound SalishRomanianRussianSalvadoranSamoanScandinavianScotch-IrishScottishSeminoleSenegaleseSerbianShoshoneSierra LeoneanSiouxSlavicSlovakSloveneSomaliSouth AfricanSouth AmericanSouth American IndianSoviet UnionSpaniardSpanishSpanish AmericanSpanish American IndianSri LankanSubsaharan AfricanSudaneseSwedishSwissSyrianTaiwaneseThaiTlingit-HaidaTohono O'OdhamTonganTrinidadian and TobagonianTsimshianTurkishU.S. Virgin IslanderUgandanUkrainianUruguayanUteVenezuelanVietnameseWelshWest IndianYakamaYaquiYugoslavianYumanYup'ikZimbabwean
Immigration
NonimmigrantsImmigrantsAfghanistanAfricaAlbaniaArgentinaArmeniaAsiaAustraliaAustriaBahamasBangladeshBarbadosBelarusBelgiumBelizeBoliviaBosnia and HerzegovinaBrazilBulgariaBurma/MyanmarCabo VerdeCambodiaCameroonCanadaCaribbeanCentral AmericaChileChinaColombiaCongoCosta RicaCroatiaCubaCzechoslovakiaDenmarkDominicaDominican RepublicEastern AfricaEastern AsiaEastern EuropeEcuadorEgyptEl SalvadorEnglandEritreaEthiopiaEuropeFijiFranceGermanyGhanaGreeceGrenadaGuatemalaGuyanaHaitiHondurasHong KongHungaryIndiaIndonesiaIranIraqIrelandIsraelItalyJamaicaJapanJordanKazakhstanKenyaKoreaKuwaitLaosLatin AmericaLatviaLebanonLiberiaLithuaniaMalaysiaMexicoMicronesiaMiddle AfricaMoldovaMoroccoNepalNetherlandsNicaraguaNigeriaNorth AmericaNorth MacedoniaNorthern AfricaNorthern EuropeNorwayOceaniaPakistanPanamaPeruPhilippinesPolandPortugalRomaniaRussiaSaudi ArabiaScotlandSenegalSerbiaSierra LeoneSingaporeSomaliaSouth AfricaSouth AmericaSouth Central AsiaSouth Eastern AsiaSouthern EuropeSpainSri LankaSt. Vincent and the GrenadinesSudanSwedenSwitzerlandSyriaTaiwanThailandTrinidad and TobagoTurkeyUgandaUkraineUruguayUzbekistanVenezuelaVietnamWest IndiesWestern AfricaWestern AsiaWestern EuropeYemenZaireZimbabweAzores
Female Unemployment
Income
Poverty
Unemployment
Labor Participation
Family Structure
Vehicle Availability
Education Level
Disability

Female Unemployment Comparison

Egyptians

Irish

Good
Exceptional
5.2%
FEMALE UNEMPLOYMENT
78.3/ 100
METRIC RATING
150th/ 347
METRIC RANK
4.7%
FEMALE UNEMPLOYMENT
99.9/ 100
METRIC RATING
28th/ 347
METRIC RANK

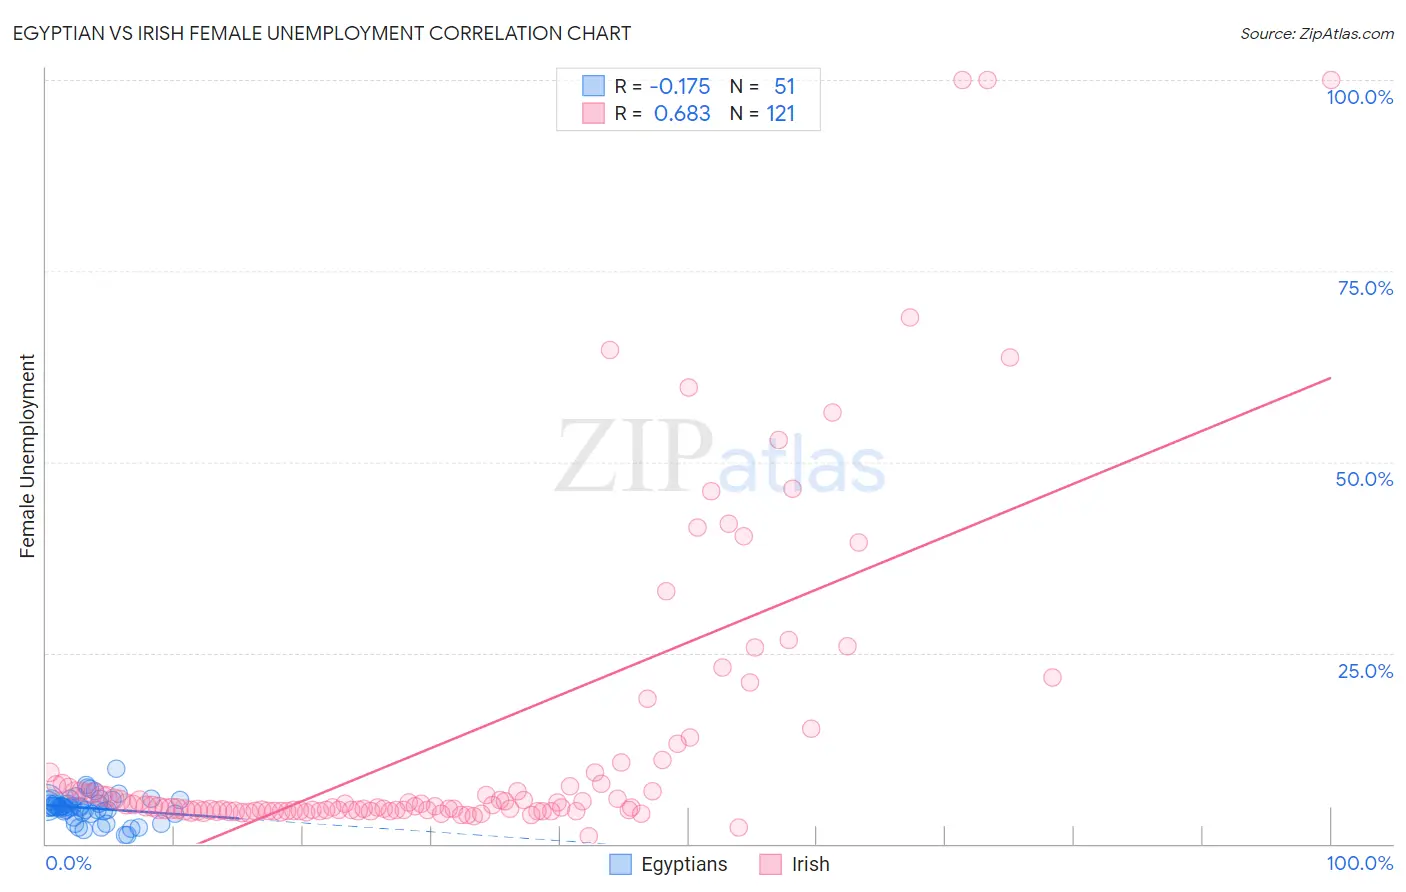
Egyptian vs Irish Female Unemployment Correlation Chart

The statistical analysis conducted on geographies consisting of 276,383,478 people shows a poor negative correlation between the proportion of Egyptians and unemploymnet rate among females in the United States with a correlation coefficient (R) of -0.175 and weighted average of 5.2%. Similarly, the statistical analysis conducted on geographies consisting of 563,665,883 people shows a significant positive correlation between the proportion of Irish and unemploymnet rate among females in the United States with a correlation coefficient (R) of 0.683 and weighted average of 4.7%, a difference of 8.8%.
Egyptian vs Irish Female Unemployment

Female Unemployment Correlation Summary

MeasurementEgyptianIrish
Minimum1.2%1.0%
Maximum9.8%100.0%
Range8.6%99.0%
Mean4.7%13.6%
Median4.9%4.9%
Interquartile 25% (IQ1)4.0%4.3%
Interquartile 75% (IQ3)5.7%8.6%
Interquartile Range (IQR)1.7%4.2%
Standard Deviation (Sample)1.7%20.3%
Standard Deviation (Population)1.7%20.2%

Similar Demographics by Female Unemployment

Demographics Similar to Egyptians by Female Unemployment

In terms of female unemployment, the demographic groups most similar to Egyptians are Asian (5.2%, a difference of 0.010%), Immigrants from Argentina (5.2%, a difference of 0.040%), Argentinean (5.2%, a difference of 0.080%), Immigrants from Norway (5.2%, a difference of 0.10%), and Immigrants from Oceania (5.2%, a difference of 0.11%).
DemographicsRating | RankFemale Unemployment
Immigrants | Kazakhstan
80.7
/100
|
#143
Excellent
5.1%
Immigrants | Jordan
80.4
/100
|
#144
Excellent
5.1%
Immigrants | Oceania
79.5
/100
|
#145
Good
5.2%
Immigrants | Norway
79.4
/100
|
#146
Good
5.2%
Argentineans
79.2
/100
|
#147
Good
5.2%
Immigrants | Argentina
78.7
/100
|
#148
Good
5.2%
Asians
78.3
/100
|
#149
Good
5.2%
Egyptians
78.3
/100
|
#150
Good
5.2%
Immigrants | China
75.9
/100
|
#151
Good
5.2%
Immigrants | Italy
75.0
/100
|
#152
Good
5.2%
Immigrants | Greece
74.9
/100
|
#153
Good
5.2%
South Africans
70.8
/100
|
#154
Good
5.2%
Immigrants | Egypt
70.0
/100
|
#155
Good
5.2%
Immigrants | Northern Africa
69.6
/100
|
#156
Good
5.2%
Immigrants | Russia
69.3
/100
|
#157
Good
5.2%

Demographics Similar to Irish by Female Unemployment

In terms of female unemployment, the demographic groups most similar to Irish are Cypriot (4.7%, a difference of 0.010%), British (4.7%, a difference of 0.030%), Lithuanian (4.7%, a difference of 0.13%), Immigrants from Bosnia and Herzegovina (4.7%, a difference of 0.20%), and Immigrants from India (4.7%, a difference of 0.24%).
DemographicsRating | RankFemale Unemployment
Fijians
99.9
/100
|
#21
Exceptional
4.7%
Europeans
99.9
/100
|
#22
Exceptional
4.7%
Scottish
99.9
/100
|
#23
Exceptional
4.7%
Welsh
99.9
/100
|
#24
Exceptional
4.7%
Immigrants | India
99.9
/100
|
#25
Exceptional
4.7%
Immigrants | Bosnia and Herzegovina
99.9
/100
|
#26
Exceptional
4.7%
British
99.9
/100
|
#27
Exceptional
4.7%
Irish
99.9
/100
|
#28
Exceptional
4.7%
Cypriots
99.9
/100
|
#29
Exceptional
4.7%
Lithuanians
99.8
/100
|
#30
Exceptional
4.7%
Sudanese
99.8
/100
|
#31
Exceptional
4.8%
Slovaks
99.8
/100
|
#32
Exceptional
4.8%
Czechoslovakians
99.7
/100
|
#33
Exceptional
4.8%
Zimbabweans
99.7
/100
|
#34
Exceptional
4.8%
French Canadians
99.7
/100
|
#35
Exceptional
4.8%