Nonimmigrants vs Irish Female Unemployment
COMPARE
Nonimmigrants
Irish
Female Unemployment
Female Unemployment Comparison
Nonimmigrants
Irish
5.3%
FEMALE UNEMPLOYMENT
42.6/ 100
METRIC RATING
182nd/ 347
METRIC RANK
4.7%
FEMALE UNEMPLOYMENT
99.9/ 100
METRIC RATING
28th/ 347
METRIC RANK
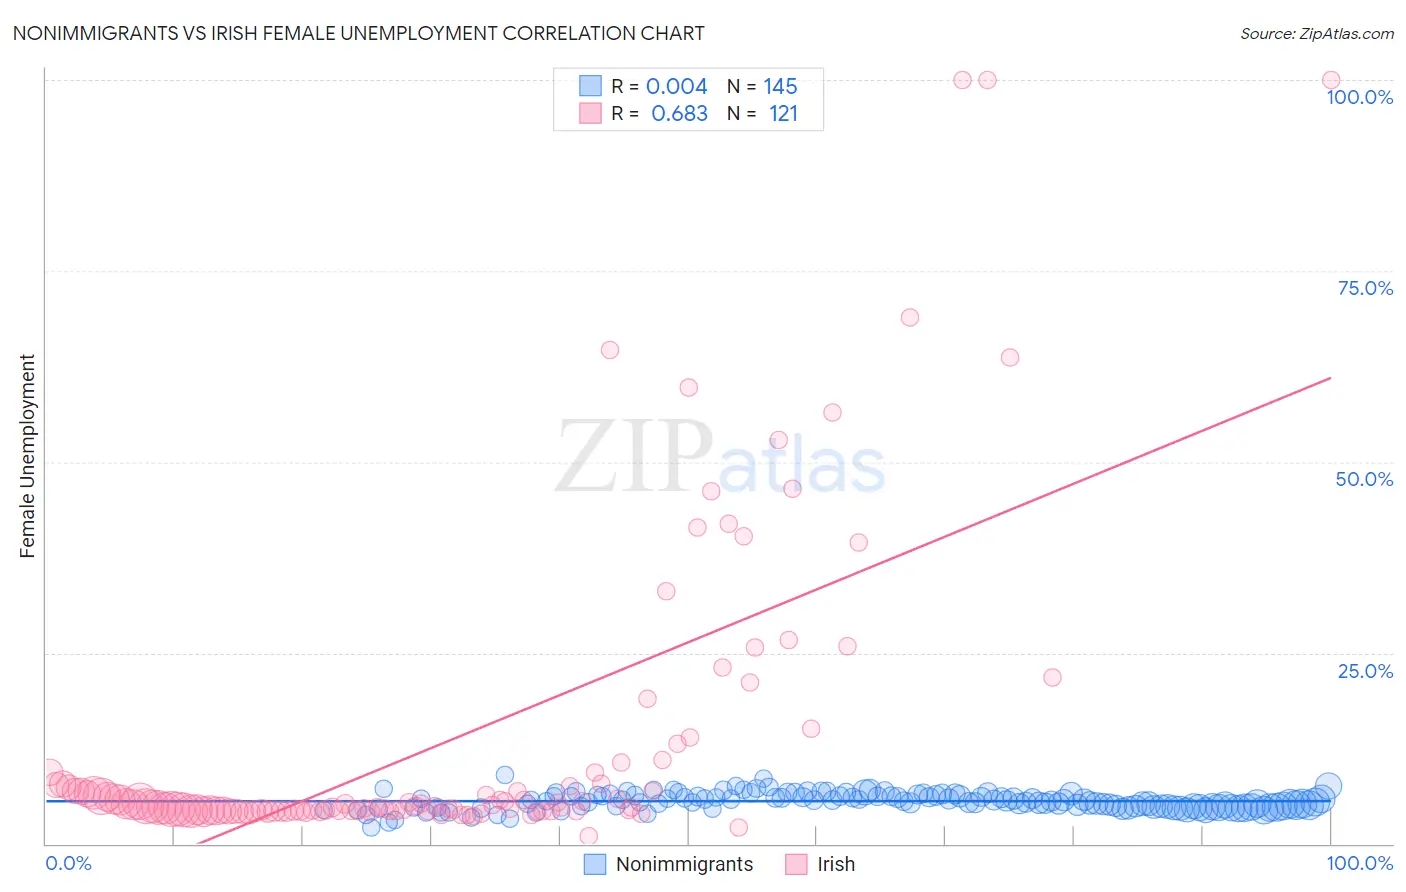
Nonimmigrants vs Irish Female Unemployment Correlation Chart
The statistical analysis conducted on geographies consisting of 567,351,562 people shows no correlation between the proportion of Nonimmigrants and unemploymnet rate among females in the United States with a correlation coefficient (R) of 0.004 and weighted average of 5.3%. Similarly, the statistical analysis conducted on geographies consisting of 563,665,883 people shows a significant positive correlation between the proportion of Irish and unemploymnet rate among females in the United States with a correlation coefficient (R) of 0.683 and weighted average of 4.7%, a difference of 11.5%.
Female Unemployment Correlation Summary
| Measurement | Nonimmigrants | Irish |
| Minimum | 2.2% | 1.0% |
| Maximum | 9.0% | 100.0% |
| Range | 6.8% | 99.0% |
| Mean | 5.6% | 13.6% |
| Median | 5.5% | 4.9% |
| Interquartile 25% (IQ1) | 4.8% | 4.3% |
| Interquartile 75% (IQ3) | 6.3% | 8.6% |
| Interquartile Range (IQR) | 1.4% | 4.2% |
| Standard Deviation (Sample) | 1.1% | 20.3% |
| Standard Deviation (Population) | 1.1% | 20.2% |
Similar Demographics by Female Unemployment
Demographics Similar to Nonimmigrants by Female Unemployment
In terms of female unemployment, the demographic groups most similar to Nonimmigrants are Taiwanese (5.3%, a difference of 0.010%), Immigrants from Congo (5.3%, a difference of 0.030%), Immigrants from Indonesia (5.3%, a difference of 0.12%), Laotian (5.3%, a difference of 0.15%), and Immigrants from Ukraine (5.3%, a difference of 0.15%).
| Demographics | Rating | Rank | Female Unemployment |
| Immigrants | Laos | 47.5 /100 | #175 | Average 5.3% |
| Immigrants | Vietnam | 47.5 /100 | #176 | Average 5.3% |
| Immigrants | Morocco | 47.4 /100 | #177 | Average 5.3% |
| Immigrants | Southern Europe | 46.2 /100 | #178 | Average 5.3% |
| Laotians | 45.1 /100 | #179 | Average 5.3% |
| Immigrants | Congo | 43.1 /100 | #180 | Average 5.3% |
| Taiwanese | 42.7 /100 | #181 | Average 5.3% |
| Immigrants | Nonimmigrants | 42.6 /100 | #182 | Average 5.3% |
| Immigrants | Indonesia | 40.7 /100 | #183 | Average 5.3% |
| Immigrants | Ukraine | 40.1 /100 | #184 | Average 5.3% |
| Malaysians | 40.1 /100 | #185 | Average 5.3% |
| Immigrants | Belarus | 39.4 /100 | #186 | Fair 5.3% |
| Immigrants | Albania | 35.4 /100 | #187 | Fair 5.3% |
| Afghans | 33.9 /100 | #188 | Fair 5.3% |
| Costa Ricans | 33.8 /100 | #189 | Fair 5.3% |
Demographics Similar to Irish by Female Unemployment
In terms of female unemployment, the demographic groups most similar to Irish are Cypriot (4.7%, a difference of 0.010%), British (4.7%, a difference of 0.030%), Lithuanian (4.7%, a difference of 0.13%), Immigrants from Bosnia and Herzegovina (4.7%, a difference of 0.20%), and Immigrants from India (4.7%, a difference of 0.24%).
| Demographics | Rating | Rank | Female Unemployment |
| Fijians | 99.9 /100 | #21 | Exceptional 4.7% |
| Europeans | 99.9 /100 | #22 | Exceptional 4.7% |
| Scottish | 99.9 /100 | #23 | Exceptional 4.7% |
| Welsh | 99.9 /100 | #24 | Exceptional 4.7% |
| Immigrants | India | 99.9 /100 | #25 | Exceptional 4.7% |
| Immigrants | Bosnia and Herzegovina | 99.9 /100 | #26 | Exceptional 4.7% |
| British | 99.9 /100 | #27 | Exceptional 4.7% |
| Irish | 99.9 /100 | #28 | Exceptional 4.7% |
| Cypriots | 99.9 /100 | #29 | Exceptional 4.7% |
| Lithuanians | 99.8 /100 | #30 | Exceptional 4.7% |
| Sudanese | 99.8 /100 | #31 | Exceptional 4.8% |
| Slovaks | 99.8 /100 | #32 | Exceptional 4.8% |
| Czechoslovakians | 99.7 /100 | #33 | Exceptional 4.8% |
| Zimbabweans | 99.7 /100 | #34 | Exceptional 4.8% |
| French Canadians | 99.7 /100 | #35 | Exceptional 4.8% |