Tohono O'odham vs Estonian Female Unemployment
COMPARE
Tohono O'odham
Estonian
Female Unemployment
Female Unemployment Comparison
Tohono O'odham
Estonians
7.7%
FEMALE UNEMPLOYMENT
0.0/ 100
METRIC RATING
338th/ 347
METRIC RANK
5.1%
FEMALE UNEMPLOYMENT
92.1/ 100
METRIC RATING
112th/ 347
METRIC RANK
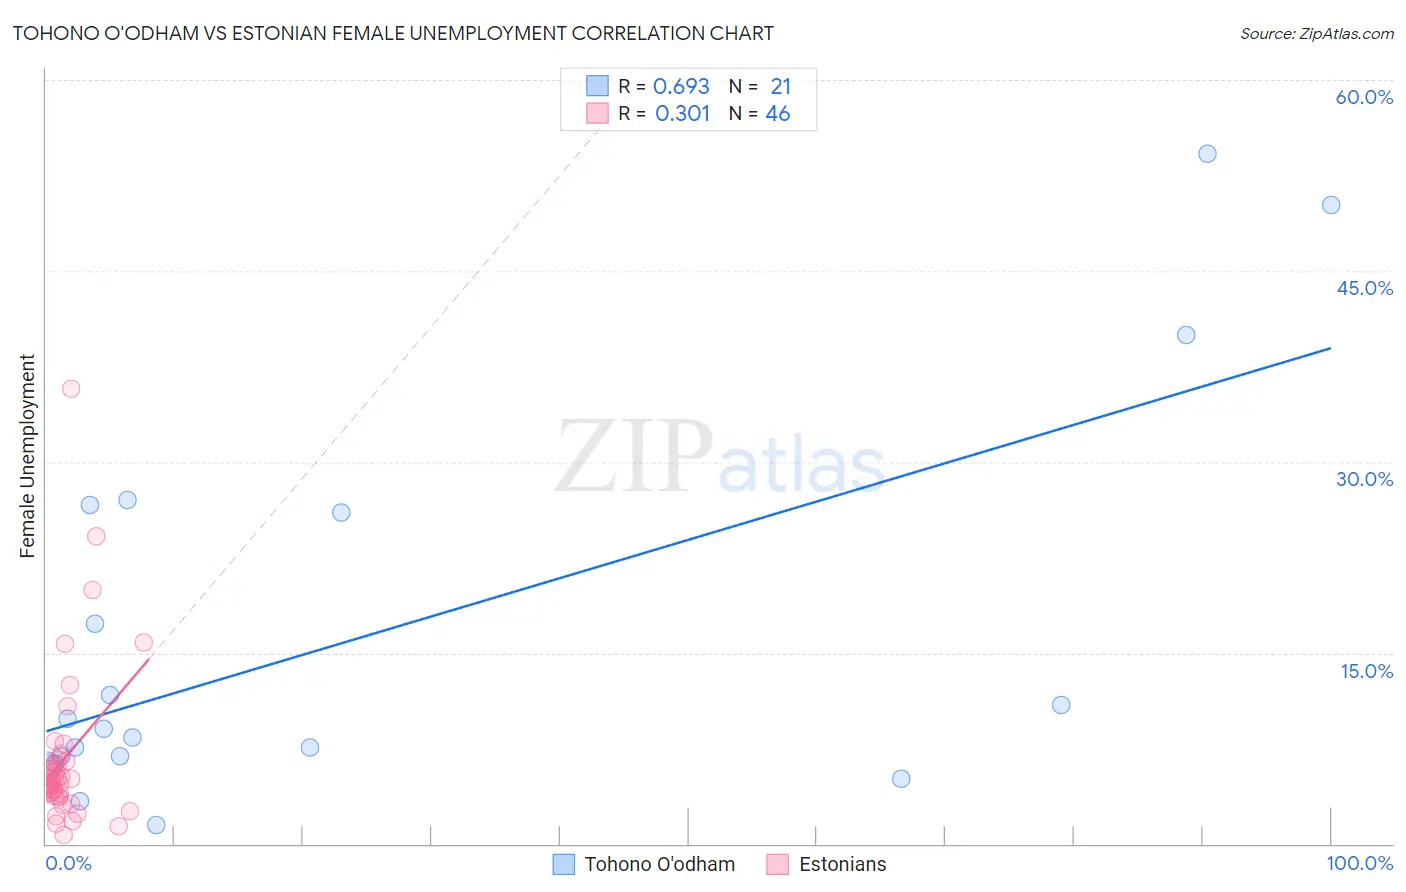
Tohono O'odham vs Estonian Female Unemployment Correlation Chart
The statistical analysis conducted on geographies consisting of 58,685,659 people shows a significant positive correlation between the proportion of Tohono O'odham and unemploymnet rate among females in the United States with a correlation coefficient (R) of 0.693 and weighted average of 7.7%. Similarly, the statistical analysis conducted on geographies consisting of 123,247,163 people shows a mild positive correlation between the proportion of Estonians and unemploymnet rate among females in the United States with a correlation coefficient (R) of 0.301 and weighted average of 5.1%, a difference of 53.0%.
Female Unemployment Correlation Summary
| Measurement | Tohono O'odham | Estonian |
| Minimum | 1.5% | 0.71% |
| Maximum | 54.2% | 35.7% |
| Range | 52.7% | 35.0% |
| Mean | 16.3% | 6.7% |
| Median | 9.0% | 4.7% |
| Interquartile 25% (IQ1) | 6.6% | 3.7% |
| Interquartile 75% (IQ3) | 26.3% | 6.5% |
| Interquartile Range (IQR) | 19.8% | 2.8% |
| Standard Deviation (Sample) | 15.4% | 6.4% |
| Standard Deviation (Population) | 15.0% | 6.3% |
Similar Demographics by Female Unemployment
Demographics Similar to Tohono O'odham by Female Unemployment
In terms of female unemployment, the demographic groups most similar to Tohono O'odham are Immigrants from Yemen (7.8%, a difference of 1.2%), Hopi (8.1%, a difference of 4.5%), Inupiat (8.2%, a difference of 5.3%), Navajo (7.3%, a difference of 6.3%), and Immigrants from Dominican Republic (7.2%, a difference of 7.3%).
| Demographics | Rating | Rank | Female Unemployment |
| Paiute | 0.0 /100 | #331 | Tragic 6.8% |
| Sioux | 0.0 /100 | #332 | Tragic 7.0% |
| Menominee | 0.0 /100 | #333 | Tragic 7.0% |
| Immigrants | Armenia | 0.0 /100 | #334 | Tragic 7.1% |
| Dominicans | 0.0 /100 | #335 | Tragic 7.2% |
| Immigrants | Dominican Republic | 0.0 /100 | #336 | Tragic 7.2% |
| Navajo | 0.0 /100 | #337 | Tragic 7.3% |
| Tohono O'odham | 0.0 /100 | #338 | Tragic 7.7% |
| Immigrants | Yemen | 0.0 /100 | #339 | Tragic 7.8% |
| Hopi | 0.0 /100 | #340 | Tragic 8.1% |
| Inupiat | 0.0 /100 | #341 | Tragic 8.2% |
| Puerto Ricans | 0.0 /100 | #342 | Tragic 8.3% |
| Arapaho | 0.0 /100 | #343 | Tragic 8.8% |
| Pima | 0.0 /100 | #344 | Tragic 9.3% |
| Yuman | 0.0 /100 | #345 | Tragic 9.6% |
Demographics Similar to Estonians by Female Unemployment
In terms of female unemployment, the demographic groups most similar to Estonians are Immigrants from Burma/Myanmar (5.1%, a difference of 0.030%), Macedonian (5.1%, a difference of 0.060%), Immigrants from Eastern Africa (5.1%, a difference of 0.16%), Immigrants from Saudi Arabia (5.1%, a difference of 0.18%), and Puget Sound Salish (5.1%, a difference of 0.20%).
| Demographics | Rating | Rank | Female Unemployment |
| Immigrants | England | 93.6 /100 | #105 | Exceptional 5.0% |
| Paraguayans | 93.2 /100 | #106 | Exceptional 5.1% |
| Immigrants | Switzerland | 93.1 /100 | #107 | Exceptional 5.1% |
| Puget Sound Salish | 93.0 /100 | #108 | Exceptional 5.1% |
| Immigrants | Eastern Africa | 92.8 /100 | #109 | Exceptional 5.1% |
| Macedonians | 92.4 /100 | #110 | Exceptional 5.1% |
| Immigrants | Burma/Myanmar | 92.3 /100 | #111 | Exceptional 5.1% |
| Estonians | 92.1 /100 | #112 | Exceptional 5.1% |
| Immigrants | Saudi Arabia | 91.2 /100 | #113 | Exceptional 5.1% |
| Immigrants | Turkey | 91.0 /100 | #114 | Exceptional 5.1% |
| Lebanese | 91.0 /100 | #115 | Exceptional 5.1% |
| Americans | 90.5 /100 | #116 | Exceptional 5.1% |
| Jordanians | 90.3 /100 | #117 | Exceptional 5.1% |
| Immigrants | Croatia | 89.9 /100 | #118 | Excellent 5.1% |
| Immigrants | North Macedonia | 88.3 /100 | #119 | Excellent 5.1% |