Tohono O'odham vs Cypriot Female Unemployment
COMPARE
Tohono O'odham
Cypriot
Female Unemployment
Female Unemployment Comparison
Tohono O'odham
Cypriots
7.7%
FEMALE UNEMPLOYMENT
0.0/ 100
METRIC RATING
338th/ 347
METRIC RANK
4.7%
FEMALE UNEMPLOYMENT
99.9/ 100
METRIC RATING
29th/ 347
METRIC RANK
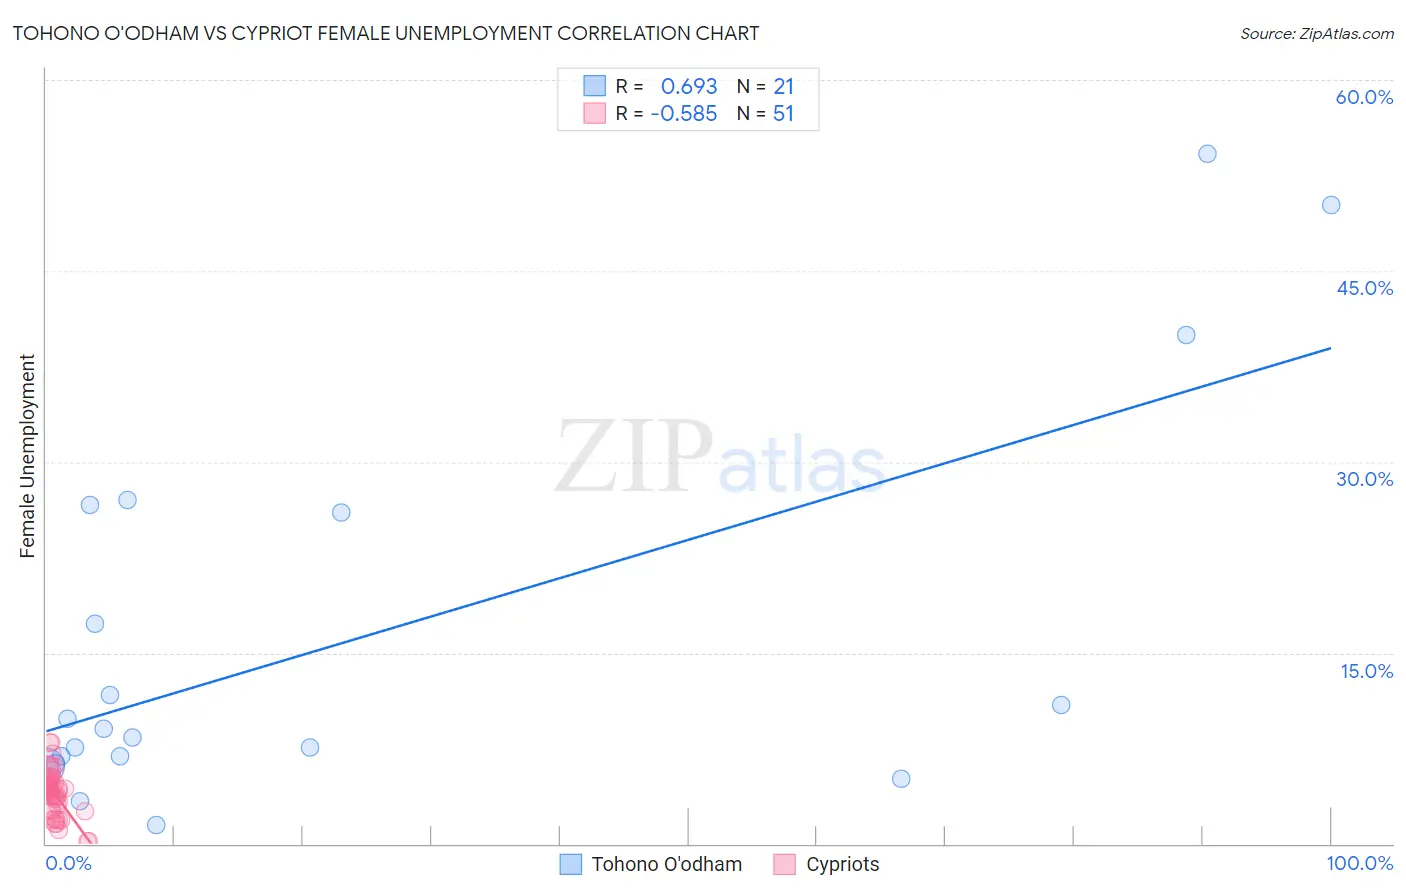
Tohono O'odham vs Cypriot Female Unemployment Correlation Chart
The statistical analysis conducted on geographies consisting of 58,685,659 people shows a significant positive correlation between the proportion of Tohono O'odham and unemploymnet rate among females in the United States with a correlation coefficient (R) of 0.693 and weighted average of 7.7%. Similarly, the statistical analysis conducted on geographies consisting of 61,829,188 people shows a substantial negative correlation between the proportion of Cypriots and unemploymnet rate among females in the United States with a correlation coefficient (R) of -0.585 and weighted average of 4.7%, a difference of 63.5%.
Female Unemployment Correlation Summary
| Measurement | Tohono O'odham | Cypriot |
| Minimum | 1.5% | 0.20% |
| Maximum | 54.2% | 8.0% |
| Range | 52.7% | 7.8% |
| Mean | 16.3% | 4.0% |
| Median | 9.0% | 4.3% |
| Interquartile 25% (IQ1) | 6.6% | 2.7% |
| Interquartile 75% (IQ3) | 26.3% | 4.9% |
| Interquartile Range (IQR) | 19.8% | 2.2% |
| Standard Deviation (Sample) | 15.4% | 1.7% |
| Standard Deviation (Population) | 15.0% | 1.7% |
Similar Demographics by Female Unemployment
Demographics Similar to Tohono O'odham by Female Unemployment
In terms of female unemployment, the demographic groups most similar to Tohono O'odham are Immigrants from Yemen (7.8%, a difference of 1.2%), Hopi (8.1%, a difference of 4.5%), Inupiat (8.2%, a difference of 5.3%), Navajo (7.3%, a difference of 6.3%), and Immigrants from Dominican Republic (7.2%, a difference of 7.3%).
| Demographics | Rating | Rank | Female Unemployment |
| Paiute | 0.0 /100 | #331 | Tragic 6.8% |
| Sioux | 0.0 /100 | #332 | Tragic 7.0% |
| Menominee | 0.0 /100 | #333 | Tragic 7.0% |
| Immigrants | Armenia | 0.0 /100 | #334 | Tragic 7.1% |
| Dominicans | 0.0 /100 | #335 | Tragic 7.2% |
| Immigrants | Dominican Republic | 0.0 /100 | #336 | Tragic 7.2% |
| Navajo | 0.0 /100 | #337 | Tragic 7.3% |
| Tohono O'odham | 0.0 /100 | #338 | Tragic 7.7% |
| Immigrants | Yemen | 0.0 /100 | #339 | Tragic 7.8% |
| Hopi | 0.0 /100 | #340 | Tragic 8.1% |
| Inupiat | 0.0 /100 | #341 | Tragic 8.2% |
| Puerto Ricans | 0.0 /100 | #342 | Tragic 8.3% |
| Arapaho | 0.0 /100 | #343 | Tragic 8.8% |
| Pima | 0.0 /100 | #344 | Tragic 9.3% |
| Yuman | 0.0 /100 | #345 | Tragic 9.6% |
Demographics Similar to Cypriots by Female Unemployment
In terms of female unemployment, the demographic groups most similar to Cypriots are Irish (4.7%, a difference of 0.010%), British (4.7%, a difference of 0.040%), Lithuanian (4.7%, a difference of 0.12%), Immigrants from Bosnia and Herzegovina (4.7%, a difference of 0.20%), and Immigrants from India (4.7%, a difference of 0.24%).
| Demographics | Rating | Rank | Female Unemployment |
| Europeans | 99.9 /100 | #22 | Exceptional 4.7% |
| Scottish | 99.9 /100 | #23 | Exceptional 4.7% |
| Welsh | 99.9 /100 | #24 | Exceptional 4.7% |
| Immigrants | India | 99.9 /100 | #25 | Exceptional 4.7% |
| Immigrants | Bosnia and Herzegovina | 99.9 /100 | #26 | Exceptional 4.7% |
| British | 99.9 /100 | #27 | Exceptional 4.7% |
| Irish | 99.9 /100 | #28 | Exceptional 4.7% |
| Cypriots | 99.9 /100 | #29 | Exceptional 4.7% |
| Lithuanians | 99.8 /100 | #30 | Exceptional 4.7% |
| Sudanese | 99.8 /100 | #31 | Exceptional 4.8% |
| Slovaks | 99.8 /100 | #32 | Exceptional 4.8% |
| Czechoslovakians | 99.7 /100 | #33 | Exceptional 4.8% |
| Zimbabweans | 99.7 /100 | #34 | Exceptional 4.8% |
| French Canadians | 99.7 /100 | #35 | Exceptional 4.8% |
| Yugoslavians | 99.7 /100 | #36 | Exceptional 4.8% |