Jamaican vs Trinidadian and Tobagonian Unemployment Among Ages 16 to 19 years
COMPARE
Jamaican
Trinidadian and Tobagonian
Unemployment Among Ages 16 to 19 years
Unemployment Among Ages 16 to 19 years Comparison
Jamaicans
Trinidadians and Tobagonians
21.7%
UNEMPLOYMENT AMONG AGES 16 TO 19 YEARS
0.0/ 100
METRIC RATING
313th/ 347
METRIC RANK
22.6%
UNEMPLOYMENT AMONG AGES 16 TO 19 YEARS
0.0/ 100
METRIC RATING
325th/ 347
METRIC RANK
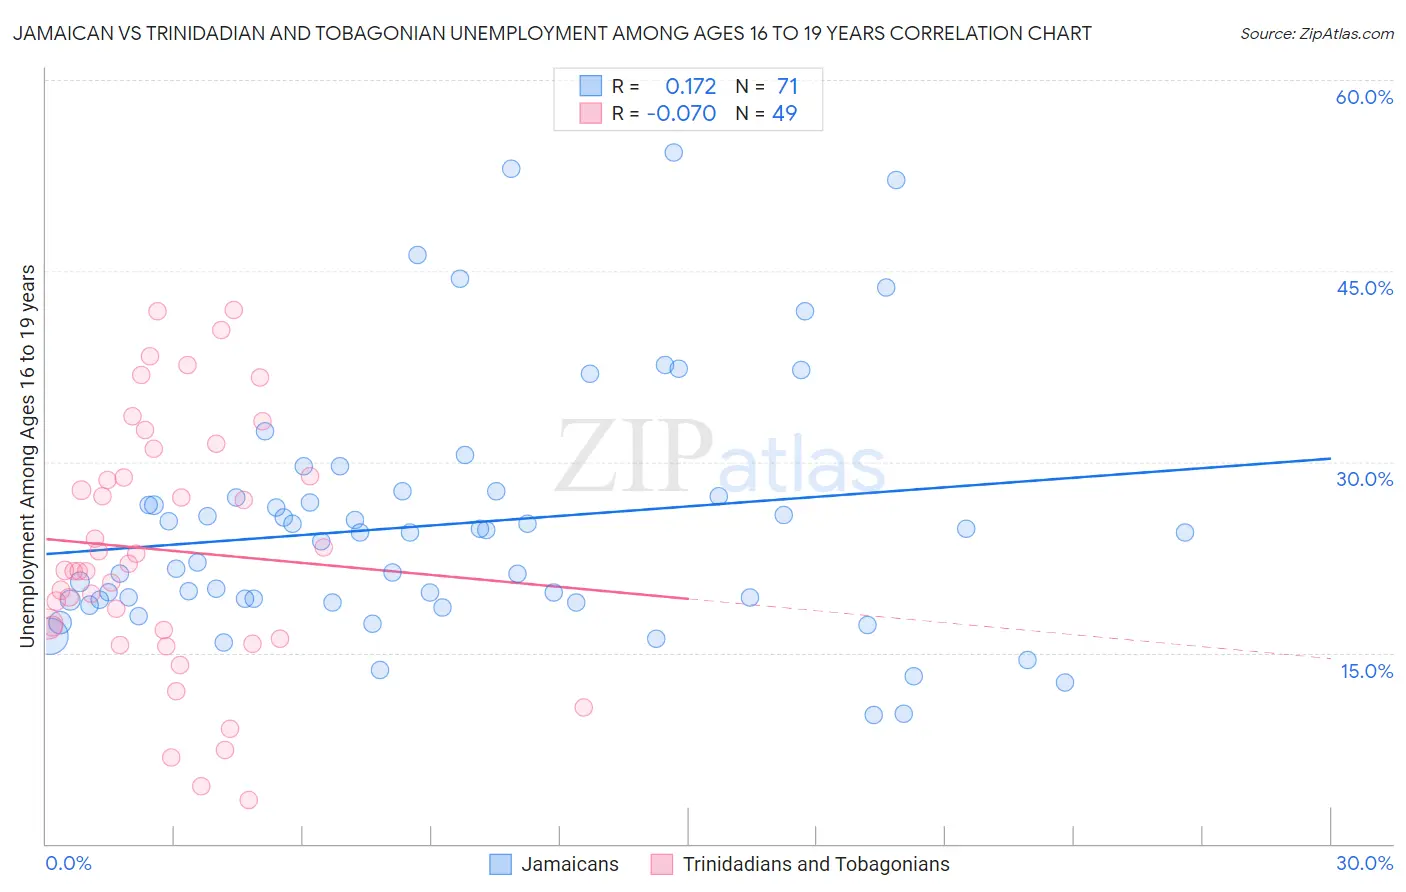
Jamaican vs Trinidadian and Tobagonian Unemployment Among Ages 16 to 19 years Correlation Chart
The statistical analysis conducted on geographies consisting of 350,975,671 people shows a poor positive correlation between the proportion of Jamaicans and unemployment rate among population between the ages 16 and 19 in the United States with a correlation coefficient (R) of 0.172 and weighted average of 21.7%. Similarly, the statistical analysis conducted on geographies consisting of 213,358,887 people shows a slight negative correlation between the proportion of Trinidadians and Tobagonians and unemployment rate among population between the ages 16 and 19 in the United States with a correlation coefficient (R) of -0.070 and weighted average of 22.6%, a difference of 4.2%.
Unemployment Among Ages 16 to 19 years Correlation Summary
| Measurement | Jamaican | Trinidadian and Tobagonian |
| Minimum | 10.1% | 3.4% |
| Maximum | 54.3% | 41.9% |
| Range | 44.2% | 38.5% |
| Mean | 25.1% | 23.1% |
| Median | 24.4% | 21.5% |
| Interquartile 25% (IQ1) | 19.1% | 16.4% |
| Interquartile 75% (IQ3) | 27.3% | 30.0% |
| Interquartile Range (IQR) | 8.2% | 13.5% |
| Standard Deviation (Sample) | 9.7% | 9.8% |
| Standard Deviation (Population) | 9.7% | 9.7% |
Demographics Similar to Jamaicans and Trinidadians and Tobagonians by Unemployment Among Ages 16 to 19 years
In terms of unemployment among ages 16 to 19 years, the demographic groups most similar to Jamaicans are Alaska Native (21.8%, a difference of 0.16%), Houma (21.6%, a difference of 0.41%), Belizean (21.6%, a difference of 0.67%), Vietnamese (21.5%, a difference of 0.89%), and Native/Alaskan (21.5%, a difference of 0.95%). Similarly, the demographic groups most similar to Trinidadians and Tobagonians are Immigrants from Armenia (22.6%, a difference of 0.12%), Yakama (22.5%, a difference of 0.57%), Barbadian (22.5%, a difference of 0.79%), West Indian (22.4%, a difference of 0.93%), and Cheyenne (22.3%, a difference of 1.6%).
| Demographics | Rating | Rank | Unemployment Among Ages 16 to 19 years |
| Natives/Alaskans | 0.0 /100 | #309 | Tragic 21.5% |
| Vietnamese | 0.0 /100 | #310 | Tragic 21.5% |
| Belizeans | 0.0 /100 | #311 | Tragic 21.6% |
| Houma | 0.0 /100 | #312 | Tragic 21.6% |
| Jamaicans | 0.0 /100 | #313 | Tragic 21.7% |
| Alaska Natives | 0.0 /100 | #314 | Tragic 21.8% |
| Immigrants | Dominica | 0.0 /100 | #315 | Tragic 21.9% |
| Tohono O'odham | 0.0 /100 | #316 | Tragic 22.1% |
| Immigrants | Belize | 0.0 /100 | #317 | Tragic 22.2% |
| Immigrants | Jamaica | 0.0 /100 | #318 | Tragic 22.2% |
| Immigrants | West Indies | 0.0 /100 | #319 | Tragic 22.2% |
| Cheyenne | 0.0 /100 | #320 | Tragic 22.3% |
| West Indians | 0.0 /100 | #321 | Tragic 22.4% |
| Barbadians | 0.0 /100 | #322 | Tragic 22.5% |
| Yakama | 0.0 /100 | #323 | Tragic 22.5% |
| Immigrants | Armenia | 0.0 /100 | #324 | Tragic 22.6% |
| Trinidadians and Tobagonians | 0.0 /100 | #325 | Tragic 22.6% |
| Immigrants | Trinidad and Tobago | 0.0 /100 | #326 | Tragic 23.1% |
| Pima | 0.0 /100 | #327 | Tragic 23.1% |
| Immigrants | Dominican Republic | 0.0 /100 | #328 | Tragic 23.3% |
| Tlingit-Haida | 0.0 /100 | #329 | Tragic 23.5% |