Paiute vs Immigrants from Iraq Unemployment Among Ages 45 to 54 years
COMPARE
Paiute
Immigrants from Iraq
Unemployment Among Ages 45 to 54 years
Unemployment Among Ages 45 to 54 years Comparison
Paiute
Immigrants from Iraq
7.8%
UNEMPLOYMENT AMONG AGES 45 TO 54 YEARS
0.0/ 100
METRIC RATING
341st/ 347
METRIC RANK
4.7%
UNEMPLOYMENT AMONG AGES 45 TO 54 YEARS
1.3/ 100
METRIC RATING
240th/ 347
METRIC RANK
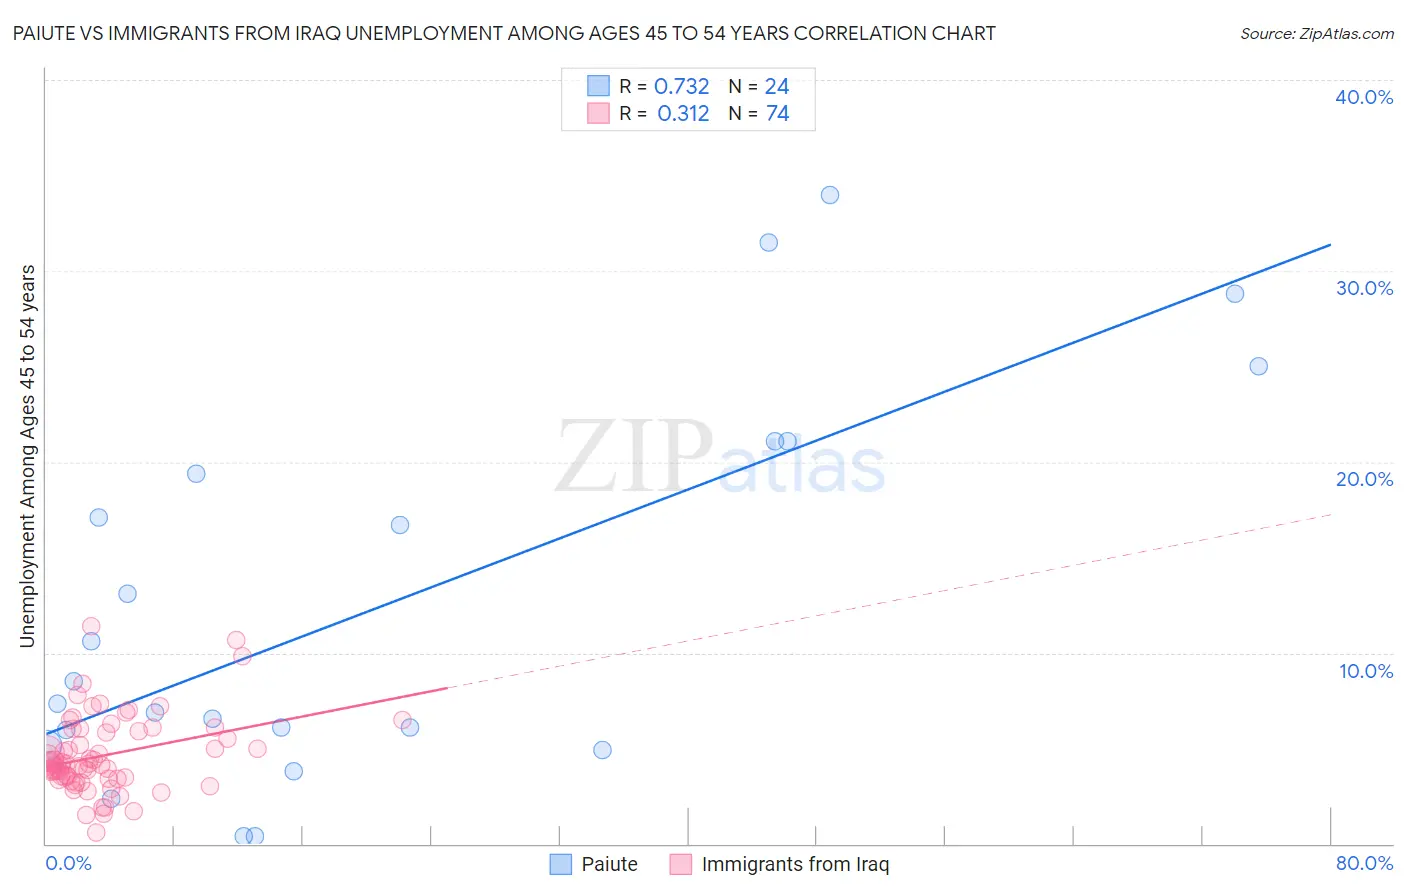
Paiute vs Immigrants from Iraq Unemployment Among Ages 45 to 54 years Correlation Chart
The statistical analysis conducted on geographies consisting of 57,983,491 people shows a strong positive correlation between the proportion of Paiute and unemployment rate among population between the ages 45 and 54 in the United States with a correlation coefficient (R) of 0.732 and weighted average of 7.8%. Similarly, the statistical analysis conducted on geographies consisting of 192,988,418 people shows a mild positive correlation between the proportion of Immigrants from Iraq and unemployment rate among population between the ages 45 and 54 in the United States with a correlation coefficient (R) of 0.312 and weighted average of 4.7%, a difference of 63.8%.
Unemployment Among Ages 45 to 54 years Correlation Summary
| Measurement | Paiute | Immigrants from Iraq |
| Minimum | 0.40% | 0.60% |
| Maximum | 34.0% | 11.4% |
| Range | 33.6% | 10.8% |
| Mean | 12.6% | 4.6% |
| Median | 7.9% | 4.2% |
| Interquartile 25% (IQ1) | 5.6% | 3.4% |
| Interquartile 75% (IQ3) | 20.3% | 5.9% |
| Interquartile Range (IQR) | 14.7% | 2.5% |
| Standard Deviation (Sample) | 10.0% | 2.0% |
| Standard Deviation (Population) | 9.8% | 2.0% |
Similar Demographics by Unemployment Among Ages 45 to 54 years
Demographics Similar to Paiute by Unemployment Among Ages 45 to 54 years
In terms of unemployment among ages 45 to 54 years, the demographic groups most similar to Paiute are Hopi (7.5%, a difference of 3.5%), Arapaho (7.5%, a difference of 4.0%), Colville (7.4%, a difference of 5.5%), Alaskan Athabascan (8.5%, a difference of 8.8%), and Apache (7.0%, a difference of 10.7%).
| Demographics | Rating | Rank | Unemployment Among Ages 45 to 54 years |
| Immigrants | Yemen | 0.0 /100 | #333 | Tragic 6.5% |
| Sioux | 0.0 /100 | #334 | Tragic 6.6% |
| Navajo | 0.0 /100 | #335 | Tragic 6.7% |
| Puerto Ricans | 0.0 /100 | #336 | Tragic 6.8% |
| Apache | 0.0 /100 | #337 | Tragic 7.0% |
| Colville | 0.0 /100 | #338 | Tragic 7.4% |
| Arapaho | 0.0 /100 | #339 | Tragic 7.5% |
| Hopi | 0.0 /100 | #340 | Tragic 7.5% |
| Paiute | 0.0 /100 | #341 | Tragic 7.8% |
| Alaskan Athabascans | 0.0 /100 | #342 | Tragic 8.5% |
| Inupiat | 0.0 /100 | #343 | Tragic 9.2% |
| Yuman | 0.0 /100 | #344 | Tragic 9.5% |
| Cheyenne | 0.0 /100 | #345 | Tragic 10.6% |
| Yup'ik | 0.0 /100 | #346 | Tragic 11.9% |
| Crow | 0.0 /100 | #347 | Tragic 13.7% |
Demographics Similar to Immigrants from Iraq by Unemployment Among Ages 45 to 54 years
In terms of unemployment among ages 45 to 54 years, the demographic groups most similar to Immigrants from Iraq are Yaqui (4.7%, a difference of 0.030%), Spanish American (4.7%, a difference of 0.030%), Delaware (4.8%, a difference of 0.070%), Central American (4.8%, a difference of 0.070%), and Portuguese (4.8%, a difference of 0.19%).
| Demographics | Rating | Rank | Unemployment Among Ages 45 to 54 years |
| Immigrants | Immigrants | 2.6 /100 | #233 | Tragic 4.7% |
| Soviet Union | 2.6 /100 | #234 | Tragic 4.7% |
| Cree | 2.3 /100 | #235 | Tragic 4.7% |
| Tlingit-Haida | 2.3 /100 | #236 | Tragic 4.7% |
| Alsatians | 1.6 /100 | #237 | Tragic 4.7% |
| Yaqui | 1.4 /100 | #238 | Tragic 4.7% |
| Spanish Americans | 1.4 /100 | #239 | Tragic 4.7% |
| Immigrants | Iraq | 1.3 /100 | #240 | Tragic 4.7% |
| Delaware | 1.3 /100 | #241 | Tragic 4.8% |
| Central Americans | 1.3 /100 | #242 | Tragic 4.8% |
| Portuguese | 1.1 /100 | #243 | Tragic 4.8% |
| Seminole | 1.1 /100 | #244 | Tragic 4.8% |
| Immigrants | Albania | 0.9 /100 | #245 | Tragic 4.8% |
| Immigrants | Syria | 0.9 /100 | #246 | Tragic 4.8% |
| Israelis | 0.9 /100 | #247 | Tragic 4.8% |