Tlingit-Haida vs Russian Unemployment Among Ages 60 to 64 years
COMPARE
Tlingit-Haida
Russian
Unemployment Among Ages 60 to 64 years
Unemployment Among Ages 60 to 64 years Comparison
Tlingit-Haida
Russians
6.4%
UNEMPLOYMENT AMONG AGES 60 TO 64 YEARS
0.0/ 100
METRIC RATING
339th/ 347
METRIC RANK
4.9%
UNEMPLOYMENT AMONG AGES 60 TO 64 YEARS
18.9/ 100
METRIC RATING
204th/ 347
METRIC RANK
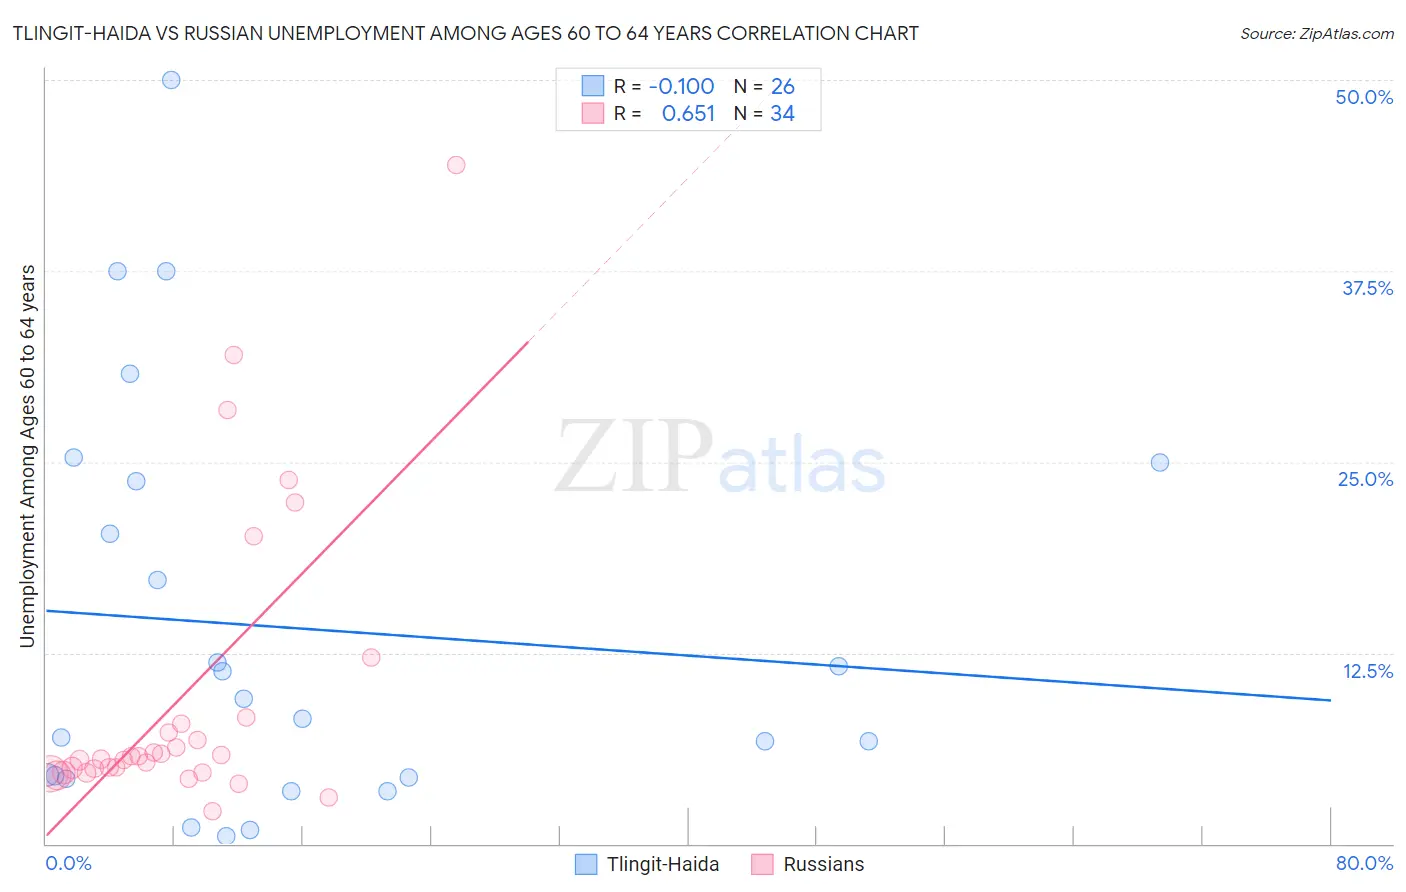
Tlingit-Haida vs Russian Unemployment Among Ages 60 to 64 years Correlation Chart
The statistical analysis conducted on geographies consisting of 58,290,195 people shows a slight negative correlation between the proportion of Tlingit-Haida and unemployment rate among population between the ages 60 and 64 in the United States with a correlation coefficient (R) of -0.100 and weighted average of 6.4%. Similarly, the statistical analysis conducted on geographies consisting of 438,522,648 people shows a significant positive correlation between the proportion of Russians and unemployment rate among population between the ages 60 and 64 in the United States with a correlation coefficient (R) of 0.651 and weighted average of 4.9%, a difference of 29.8%.
Unemployment Among Ages 60 to 64 years Correlation Summary
| Measurement | Tlingit-Haida | Russian |
| Minimum | 0.50% | 2.1% |
| Maximum | 50.0% | 44.4% |
| Range | 49.5% | 42.3% |
| Mean | 14.1% | 9.6% |
| Median | 8.8% | 5.6% |
| Interquartile 25% (IQ1) | 4.3% | 4.7% |
| Interquartile 75% (IQ3) | 23.7% | 7.8% |
| Interquartile Range (IQR) | 19.4% | 3.2% |
| Standard Deviation (Sample) | 13.3% | 9.7% |
| Standard Deviation (Population) | 13.0% | 9.5% |
Similar Demographics by Unemployment Among Ages 60 to 64 years
Demographics Similar to Tlingit-Haida by Unemployment Among Ages 60 to 64 years
In terms of unemployment among ages 60 to 64 years, the demographic groups most similar to Tlingit-Haida are Arapaho (6.3%, a difference of 1.4%), Navajo (6.3%, a difference of 1.9%), Kiowa (6.2%, a difference of 3.0%), Vietnamese (6.1%, a difference of 5.0%), and Puerto Rican (6.1%, a difference of 5.2%).
| Demographics | Rating | Rank | Unemployment Among Ages 60 to 64 years |
| Dominicans | 0.0 /100 | #332 | Tragic 6.0% |
| Immigrants | Dominican Republic | 0.0 /100 | #333 | Tragic 6.0% |
| Puerto Ricans | 0.0 /100 | #334 | Tragic 6.1% |
| Vietnamese | 0.0 /100 | #335 | Tragic 6.1% |
| Kiowa | 0.0 /100 | #336 | Tragic 6.2% |
| Navajo | 0.0 /100 | #337 | Tragic 6.3% |
| Arapaho | 0.0 /100 | #338 | Tragic 6.3% |
| Tlingit-Haida | 0.0 /100 | #339 | Tragic 6.4% |
| Pueblo | 0.0 /100 | #340 | Tragic 6.7% |
| Yuman | 0.0 /100 | #341 | Tragic 6.8% |
| Aleuts | 0.0 /100 | #342 | Tragic 6.8% |
| Immigrants | Yemen | 0.0 /100 | #343 | Tragic 6.8% |
| Alaska Natives | 0.0 /100 | #344 | Tragic 7.6% |
| Alaskan Athabascans | 0.0 /100 | #345 | Tragic 8.4% |
| Inupiat | 0.0 /100 | #346 | Tragic 9.6% |
Demographics Similar to Russians by Unemployment Among Ages 60 to 64 years
In terms of unemployment among ages 60 to 64 years, the demographic groups most similar to Russians are Uruguayan (4.9%, a difference of 0.060%), Immigrants from Indonesia (4.9%, a difference of 0.080%), New Zealander (4.9%, a difference of 0.080%), Chippewa (4.9%, a difference of 0.090%), and Immigrants from Western Africa (4.9%, a difference of 0.10%).
| Demographics | Rating | Rank | Unemployment Among Ages 60 to 64 years |
| Immigrants | Eastern Europe | 25.2 /100 | #197 | Fair 4.9% |
| Guamanians/Chamorros | 23.7 /100 | #198 | Fair 4.9% |
| Immigrants | Vietnam | 23.7 /100 | #199 | Fair 4.9% |
| Immigrants | Czechoslovakia | 23.5 /100 | #200 | Fair 4.9% |
| Colombians | 22.7 /100 | #201 | Fair 4.9% |
| Immigrants | Western Africa | 20.6 /100 | #202 | Fair 4.9% |
| Uruguayans | 19.9 /100 | #203 | Poor 4.9% |
| Russians | 18.9 /100 | #204 | Poor 4.9% |
| Immigrants | Indonesia | 17.4 /100 | #205 | Poor 4.9% |
| New Zealanders | 17.4 /100 | #206 | Poor 4.9% |
| Chippewa | 17.3 /100 | #207 | Poor 4.9% |
| German Russians | 16.8 /100 | #208 | Poor 4.9% |
| Sierra Leoneans | 16.5 /100 | #209 | Poor 4.9% |
| Cherokee | 16.1 /100 | #210 | Poor 4.9% |
| Blackfeet | 15.7 /100 | #211 | Poor 4.9% |