Mexican American Indian vs British West Indian Male Unemployment
COMPARE
Mexican American Indian
British West Indian
Male Unemployment
Male Unemployment Comparison
Mexican American Indians
British West Indians
5.8%
MALE UNEMPLOYMENT
0.2/ 100
METRIC RATING
253rd/ 347
METRIC RANK
7.3%
MALE UNEMPLOYMENT
0.0/ 100
METRIC RATING
319th/ 347
METRIC RANK
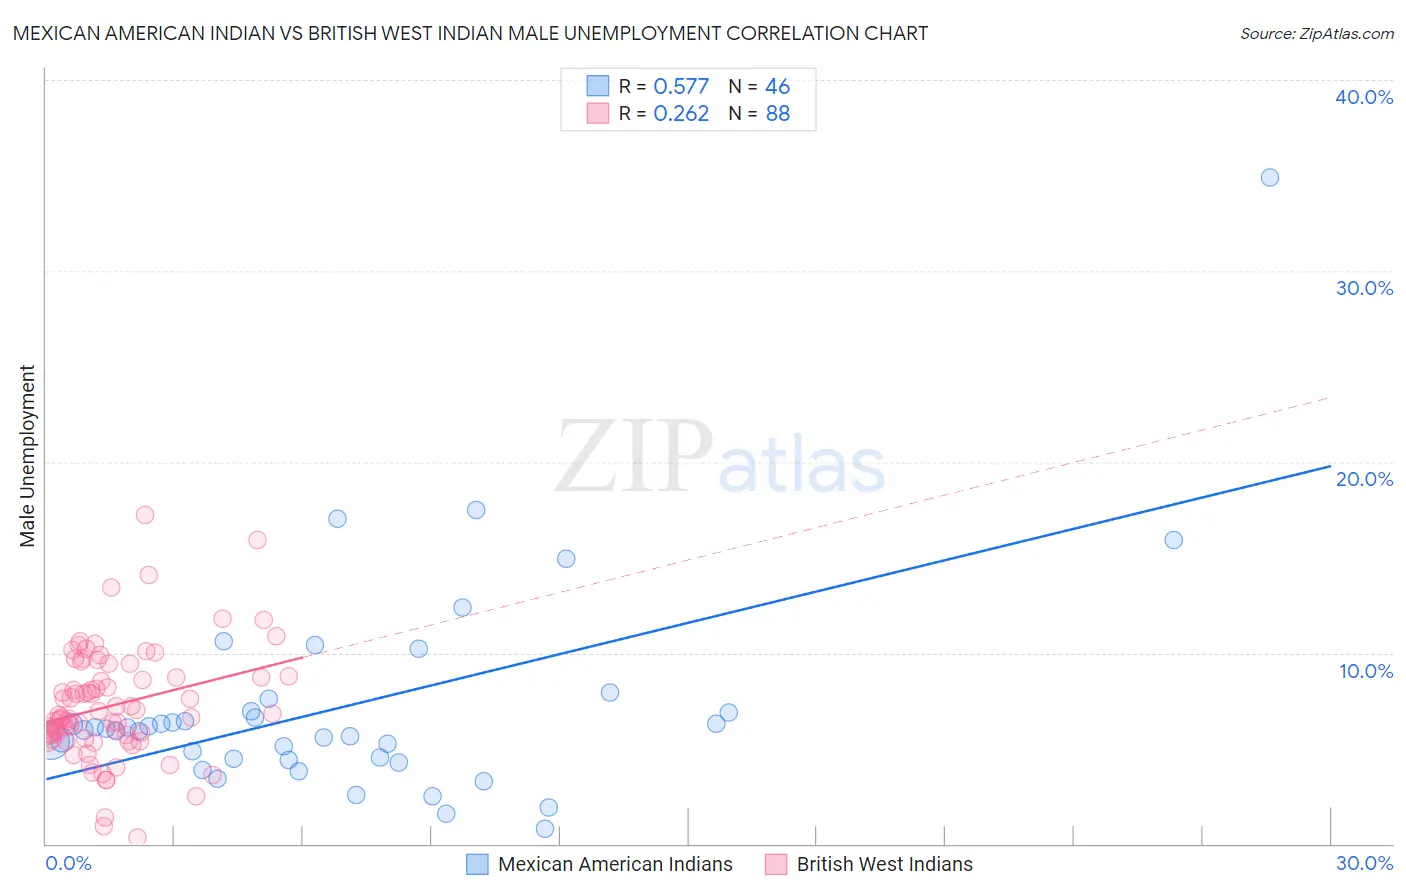
Mexican American Indian vs British West Indian Male Unemployment Correlation Chart
The statistical analysis conducted on geographies consisting of 316,861,577 people shows a substantial positive correlation between the proportion of Mexican American Indians and unemployment rate among males in the United States with a correlation coefficient (R) of 0.577 and weighted average of 5.8%. Similarly, the statistical analysis conducted on geographies consisting of 152,492,993 people shows a weak positive correlation between the proportion of British West Indians and unemployment rate among males in the United States with a correlation coefficient (R) of 0.262 and weighted average of 7.3%, a difference of 26.5%.
Male Unemployment Correlation Summary
| Measurement | Mexican American Indian | British West Indian |
| Minimum | 0.80% | 0.30% |
| Maximum | 34.9% | 17.2% |
| Range | 34.1% | 16.9% |
| Mean | 7.2% | 7.2% |
| Median | 6.0% | 6.7% |
| Interquartile 25% (IQ1) | 4.4% | 5.6% |
| Interquartile 75% (IQ3) | 6.9% | 8.8% |
| Interquartile Range (IQR) | 2.5% | 3.2% |
| Standard Deviation (Sample) | 5.6% | 2.9% |
| Standard Deviation (Population) | 5.6% | 2.9% |
Similar Demographics by Male Unemployment
Demographics Similar to Mexican American Indians by Male Unemployment
In terms of male unemployment, the demographic groups most similar to Mexican American Indians are Mexican (5.8%, a difference of 0.13%), Japanese (5.8%, a difference of 0.17%), Kiowa (5.8%, a difference of 0.28%), Comanche (5.8%, a difference of 0.35%), and Hispanic or Latino (5.8%, a difference of 0.52%).
| Demographics | Rating | Rank | Male Unemployment |
| Iroquois | 0.6 /100 | #246 | Tragic 5.7% |
| Hawaiians | 0.6 /100 | #247 | Tragic 5.7% |
| Marshallese | 0.5 /100 | #248 | Tragic 5.7% |
| Cree | 0.4 /100 | #249 | Tragic 5.7% |
| Immigrants | Bahamas | 0.4 /100 | #250 | Tragic 5.7% |
| Spanish Americans | 0.3 /100 | #251 | Tragic 5.7% |
| Mexicans | 0.2 /100 | #252 | Tragic 5.8% |
| Mexican American Indians | 0.2 /100 | #253 | Tragic 5.8% |
| Japanese | 0.2 /100 | #254 | Tragic 5.8% |
| Kiowa | 0.2 /100 | #255 | Tragic 5.8% |
| Comanche | 0.2 /100 | #256 | Tragic 5.8% |
| Hispanics or Latinos | 0.1 /100 | #257 | Tragic 5.8% |
| Dutch West Indians | 0.1 /100 | #258 | Tragic 5.8% |
| Cajuns | 0.1 /100 | #259 | Tragic 5.8% |
| Immigrants | Central America | 0.1 /100 | #260 | Tragic 5.8% |
Demographics Similar to British West Indians by Male Unemployment
In terms of male unemployment, the demographic groups most similar to British West Indians are Colville (7.4%, a difference of 0.90%), Immigrants from St. Vincent and the Grenadines (7.5%, a difference of 2.3%), Cape Verdean (7.1%, a difference of 2.5%), Immigrants from Cabo Verde (7.5%, a difference of 2.6%), and Guyanese (7.1%, a difference of 2.6%).
| Demographics | Rating | Rank | Male Unemployment |
| Lumbee | 0.0 /100 | #312 | Tragic 6.9% |
| Immigrants | Dominica | 0.0 /100 | #313 | Tragic 7.0% |
| Immigrants | Barbados | 0.0 /100 | #314 | Tragic 7.1% |
| Houma | 0.0 /100 | #315 | Tragic 7.1% |
| Immigrants | Guyana | 0.0 /100 | #316 | Tragic 7.1% |
| Guyanese | 0.0 /100 | #317 | Tragic 7.1% |
| Cape Verdeans | 0.0 /100 | #318 | Tragic 7.1% |
| British West Indians | 0.0 /100 | #319 | Tragic 7.3% |
| Colville | 0.0 /100 | #320 | Tragic 7.4% |
| Immigrants | St. Vincent and the Grenadines | 0.0 /100 | #321 | Tragic 7.5% |
| Immigrants | Cabo Verde | 0.0 /100 | #322 | Tragic 7.5% |
| Immigrants | Grenada | 0.0 /100 | #323 | Tragic 7.6% |
| Dominicans | 0.0 /100 | #324 | Tragic 7.6% |
| Shoshone | 0.0 /100 | #325 | Tragic 7.6% |
| Immigrants | Dominican Republic | 0.0 /100 | #326 | Tragic 7.6% |