Immigrants from Spain vs Immigrants from Senegal Female Unemployment
COMPARE
Immigrants from Spain
Immigrants from Senegal
Female Unemployment
Female Unemployment Comparison
Immigrants from Spain
Immigrants from Senegal
5.2%
FEMALE UNEMPLOYMENT
66.8/ 100
METRIC RATING
160th/ 347
METRIC RANK
6.1%
FEMALE UNEMPLOYMENT
0.0/ 100
METRIC RATING
284th/ 347
METRIC RANK
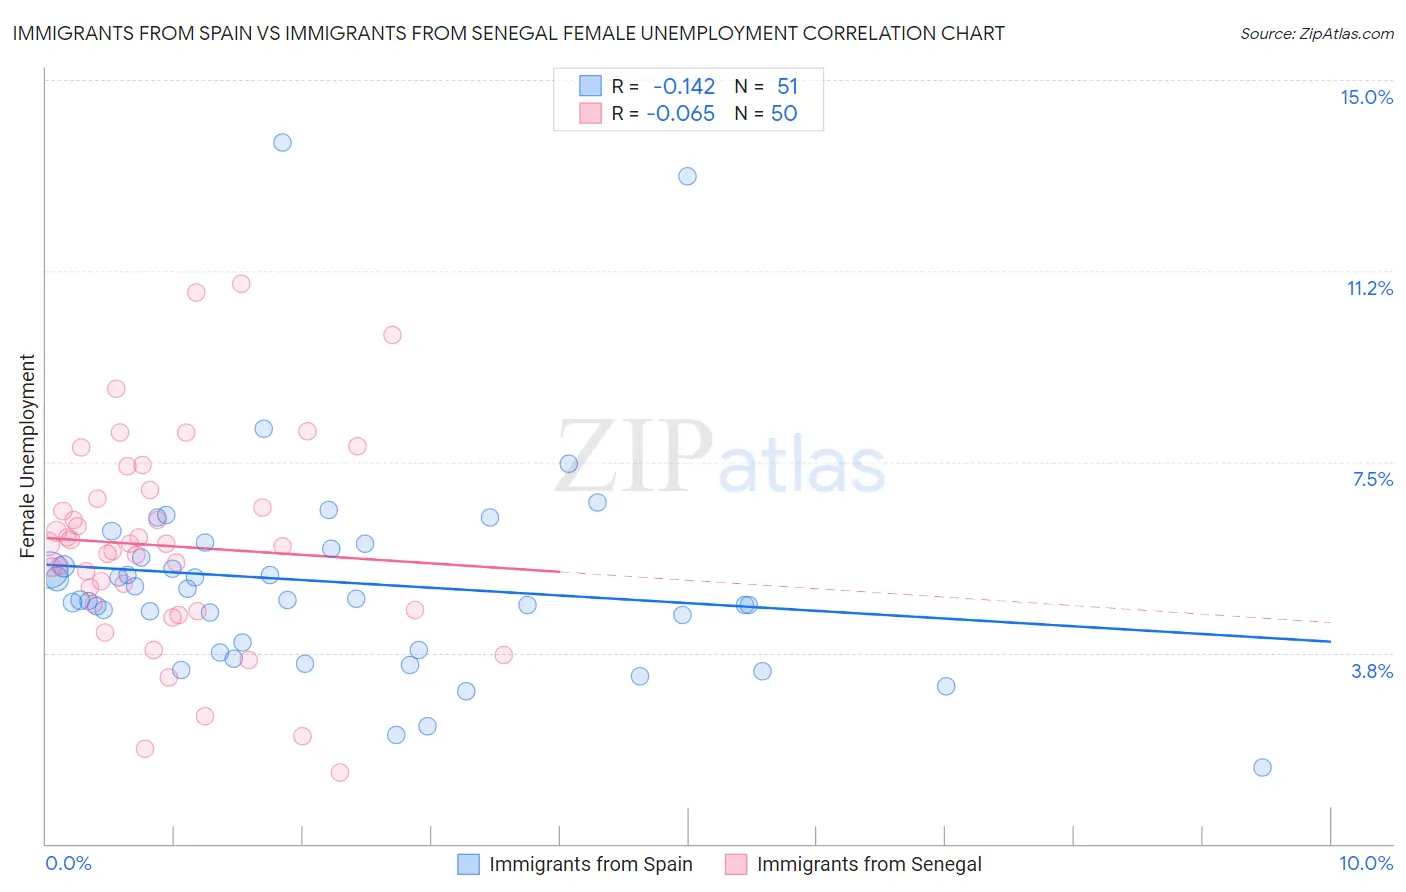
Immigrants from Spain vs Immigrants from Senegal Female Unemployment Correlation Chart
The statistical analysis conducted on geographies consisting of 239,203,477 people shows a poor negative correlation between the proportion of Immigrants from Spain and unemploymnet rate among females in the United States with a correlation coefficient (R) of -0.142 and weighted average of 5.2%. Similarly, the statistical analysis conducted on geographies consisting of 90,121,254 people shows a slight negative correlation between the proportion of Immigrants from Senegal and unemploymnet rate among females in the United States with a correlation coefficient (R) of -0.065 and weighted average of 6.1%, a difference of 16.5%.
Female Unemployment Correlation Summary
| Measurement | Immigrants from Spain | Immigrants from Senegal |
| Minimum | 1.5% | 1.4% |
| Maximum | 13.8% | 11.0% |
| Range | 12.3% | 9.6% |
| Mean | 5.1% | 5.8% |
| Median | 4.8% | 5.9% |
| Interquartile 25% (IQ1) | 3.8% | 4.6% |
| Interquartile 75% (IQ3) | 5.8% | 6.8% |
| Interquartile Range (IQR) | 2.0% | 2.2% |
| Standard Deviation (Sample) | 2.1% | 2.0% |
| Standard Deviation (Population) | 2.1% | 2.0% |
Similar Demographics by Female Unemployment
Demographics Similar to Immigrants from Spain by Female Unemployment
In terms of female unemployment, the demographic groups most similar to Immigrants from Spain are Immigrants from Pakistan (5.2%, a difference of 0.0%), Immigrants from Micronesia (5.2%, a difference of 0.010%), Potawatomi (5.2%, a difference of 0.060%), Albanian (5.2%, a difference of 0.11%), and Immigrants from Asia (5.2%, a difference of 0.17%).
| Demographics | Rating | Rank | Female Unemployment |
| Immigrants | Greece | 74.9 /100 | #153 | Good 5.2% |
| South Africans | 70.8 /100 | #154 | Good 5.2% |
| Immigrants | Egypt | 70.0 /100 | #155 | Good 5.2% |
| Immigrants | Northern Africa | 69.6 /100 | #156 | Good 5.2% |
| Immigrants | Russia | 69.3 /100 | #157 | Good 5.2% |
| Albanians | 68.3 /100 | #158 | Good 5.2% |
| Immigrants | Micronesia | 66.9 /100 | #159 | Good 5.2% |
| Immigrants | Spain | 66.8 /100 | #160 | Good 5.2% |
| Immigrants | Pakistan | 66.7 /100 | #161 | Good 5.2% |
| Potawatomi | 65.9 /100 | #162 | Good 5.2% |
| Immigrants | Asia | 64.3 /100 | #163 | Good 5.2% |
| Bangladeshis | 64.3 /100 | #164 | Good 5.2% |
| Syrians | 62.8 /100 | #165 | Good 5.2% |
| Native Hawaiians | 62.7 /100 | #166 | Good 5.2% |
| Immigrants | Thailand | 62.1 /100 | #167 | Good 5.2% |
Demographics Similar to Immigrants from Senegal by Female Unemployment
In terms of female unemployment, the demographic groups most similar to Immigrants from Senegal are Salvadoran (6.0%, a difference of 0.34%), Immigrants from Cabo Verde (6.1%, a difference of 0.38%), Chippewa (6.1%, a difference of 0.40%), Immigrants from Guatemala (6.1%, a difference of 0.43%), and Colville (6.0%, a difference of 0.44%).
| Demographics | Rating | Rank | Female Unemployment |
| Immigrants | Ghana | 0.0 /100 | #277 | Tragic 6.0% |
| Yaqui | 0.0 /100 | #278 | Tragic 6.0% |
| Armenians | 0.0 /100 | #279 | Tragic 6.0% |
| Mexican American Indians | 0.0 /100 | #280 | Tragic 6.0% |
| Guatemalans | 0.0 /100 | #281 | Tragic 6.0% |
| Colville | 0.0 /100 | #282 | Tragic 6.0% |
| Salvadorans | 0.0 /100 | #283 | Tragic 6.0% |
| Immigrants | Senegal | 0.0 /100 | #284 | Tragic 6.1% |
| Immigrants | Cabo Verde | 0.0 /100 | #285 | Tragic 6.1% |
| Chippewa | 0.0 /100 | #286 | Tragic 6.1% |
| Immigrants | Guatemala | 0.0 /100 | #287 | Tragic 6.1% |
| Haitians | 0.0 /100 | #288 | Tragic 6.1% |
| Trinidadians and Tobagonians | 0.0 /100 | #289 | Tragic 6.1% |
| Immigrants | Caribbean | 0.0 /100 | #290 | Tragic 6.1% |
| Immigrants | West Indies | 0.0 /100 | #291 | Tragic 6.1% |