Taiwanese vs Brazilian Female Unemployment
COMPARE
Taiwanese
Brazilian
Female Unemployment
Female Unemployment Comparison
Taiwanese
Brazilians
5.3%
FEMALE UNEMPLOYMENT
42.7/ 100
METRIC RATING
181st/ 347
METRIC RANK
5.5%
FEMALE UNEMPLOYMENT
7.3/ 100
METRIC RATING
221st/ 347
METRIC RANK
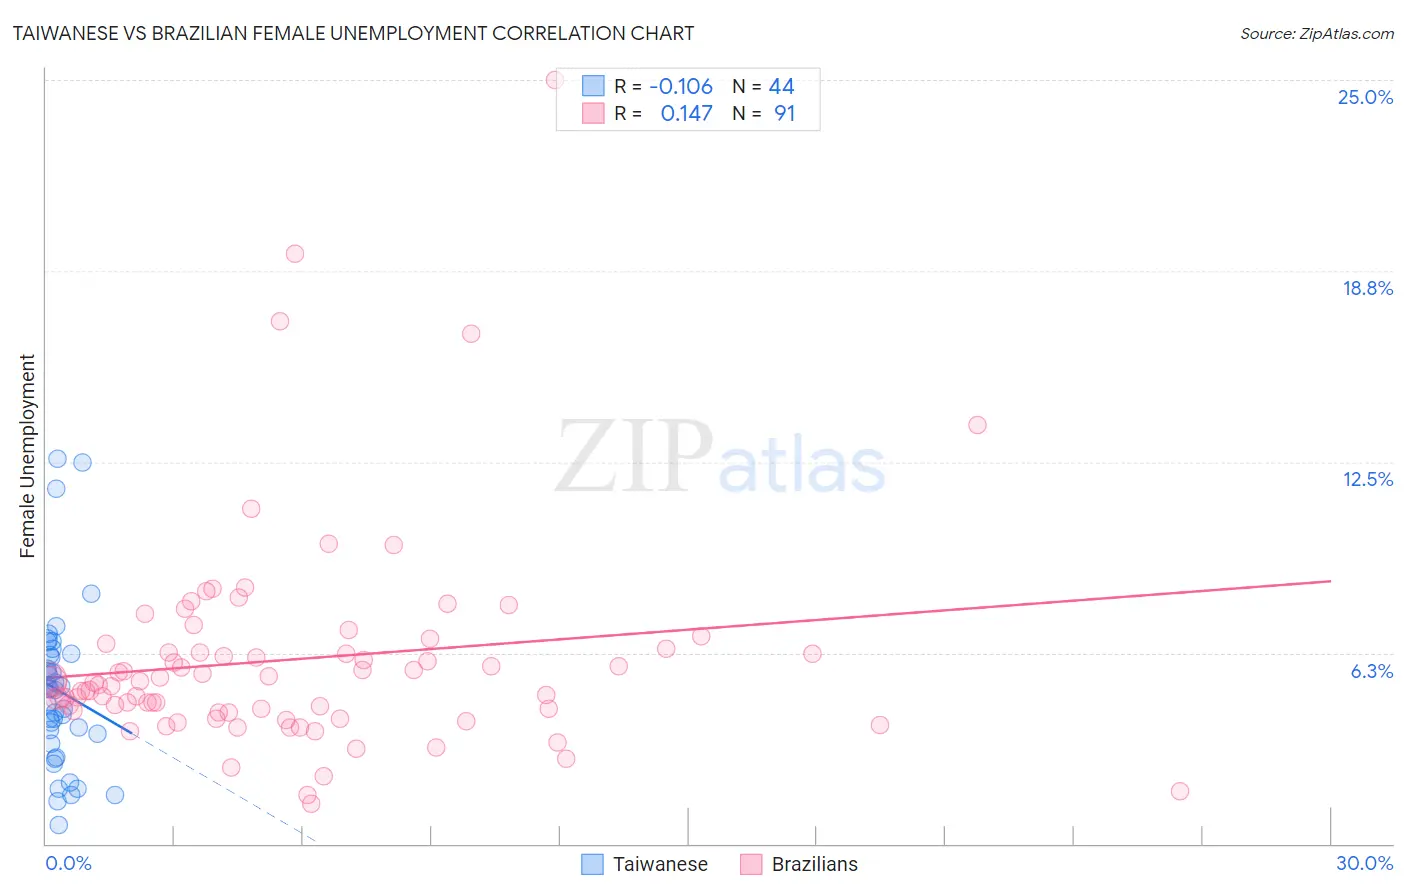
Taiwanese vs Brazilian Female Unemployment Correlation Chart
The statistical analysis conducted on geographies consisting of 31,724,268 people shows a poor negative correlation between the proportion of Taiwanese and unemploymnet rate among females in the United States with a correlation coefficient (R) of -0.106 and weighted average of 5.3%. Similarly, the statistical analysis conducted on geographies consisting of 323,090,102 people shows a poor positive correlation between the proportion of Brazilians and unemploymnet rate among females in the United States with a correlation coefficient (R) of 0.147 and weighted average of 5.5%, a difference of 3.4%.
Female Unemployment Correlation Summary
| Measurement | Taiwanese | Brazilian |
| Minimum | 0.60% | 1.3% |
| Maximum | 12.6% | 25.0% |
| Range | 12.0% | 23.7% |
| Mean | 5.0% | 6.0% |
| Median | 5.0% | 5.3% |
| Interquartile 25% (IQ1) | 3.4% | 4.3% |
| Interquartile 75% (IQ3) | 6.2% | 6.4% |
| Interquartile Range (IQR) | 2.8% | 2.1% |
| Standard Deviation (Sample) | 2.7% | 3.6% |
| Standard Deviation (Population) | 2.6% | 3.6% |
Similar Demographics by Female Unemployment
Demographics Similar to Taiwanese by Female Unemployment
In terms of female unemployment, the demographic groups most similar to Taiwanese are Nonimmigrants (5.3%, a difference of 0.010%), Immigrants from Congo (5.3%, a difference of 0.020%), Immigrants from Indonesia (5.3%, a difference of 0.12%), Laotian (5.3%, a difference of 0.14%), and Immigrants from Ukraine (5.3%, a difference of 0.16%).
| Demographics | Rating | Rank | Female Unemployment |
| Immigrants | Poland | 50.0 /100 | #174 | Average 5.3% |
| Immigrants | Laos | 47.5 /100 | #175 | Average 5.3% |
| Immigrants | Vietnam | 47.5 /100 | #176 | Average 5.3% |
| Immigrants | Morocco | 47.4 /100 | #177 | Average 5.3% |
| Immigrants | Southern Europe | 46.2 /100 | #178 | Average 5.3% |
| Laotians | 45.1 /100 | #179 | Average 5.3% |
| Immigrants | Congo | 43.1 /100 | #180 | Average 5.3% |
| Taiwanese | 42.7 /100 | #181 | Average 5.3% |
| Immigrants | Nonimmigrants | 42.6 /100 | #182 | Average 5.3% |
| Immigrants | Indonesia | 40.7 /100 | #183 | Average 5.3% |
| Immigrants | Ukraine | 40.1 /100 | #184 | Average 5.3% |
| Malaysians | 40.1 /100 | #185 | Average 5.3% |
| Immigrants | Belarus | 39.4 /100 | #186 | Fair 5.3% |
| Immigrants | Albania | 35.4 /100 | #187 | Fair 5.3% |
| Afghans | 33.9 /100 | #188 | Fair 5.3% |
Demographics Similar to Brazilians by Female Unemployment
In terms of female unemployment, the demographic groups most similar to Brazilians are Nicaraguan (5.5%, a difference of 0.020%), Delaware (5.5%, a difference of 0.030%), Iraqi (5.5%, a difference of 0.060%), Immigrants from Africa (5.4%, a difference of 0.25%), and South American (5.4%, a difference of 0.26%).
| Demographics | Rating | Rank | Female Unemployment |
| Seminole | 10.3 /100 | #214 | Poor 5.4% |
| Immigrants | Nicaragua | 10.2 /100 | #215 | Poor 5.4% |
| Comanche | 10.0 /100 | #216 | Poor 5.4% |
| Peruvians | 9.6 /100 | #217 | Tragic 5.4% |
| Bermudans | 9.0 /100 | #218 | Tragic 5.4% |
| South Americans | 8.6 /100 | #219 | Tragic 5.4% |
| Immigrants | Africa | 8.5 /100 | #220 | Tragic 5.4% |
| Brazilians | 7.3 /100 | #221 | Tragic 5.5% |
| Nicaraguans | 7.2 /100 | #222 | Tragic 5.5% |
| Delaware | 7.2 /100 | #223 | Tragic 5.5% |
| Iraqis | 7.1 /100 | #224 | Tragic 5.5% |
| French American Indians | 6.1 /100 | #225 | Tragic 5.5% |
| Immigrants | Peru | 5.9 /100 | #226 | Tragic 5.5% |
| Immigrants | Philippines | 5.3 /100 | #227 | Tragic 5.5% |
| Israelis | 4.8 /100 | #228 | Tragic 5.5% |