Marshallese vs Pima Unemployment Among Women with Children Ages 6 to 17 years
COMPARE
Marshallese
Pima
Unemployment Among Women with Children Ages 6 to 17 years
Unemployment Among Women with Children Ages 6 to 17 years Comparison
Marshallese
Pima
8.3%
UNEMPLOYMENT AMONG WOMEN WITH CHILDREN AGES 6 TO 17 YEARS
99.9/ 100
METRIC RATING
68th/ 347
METRIC RANK
18.9%
UNEMPLOYMENT AMONG WOMEN WITH CHILDREN AGES 6 TO 17 YEARS
0.0/ 100
METRIC RATING
347th/ 347
METRIC RANK
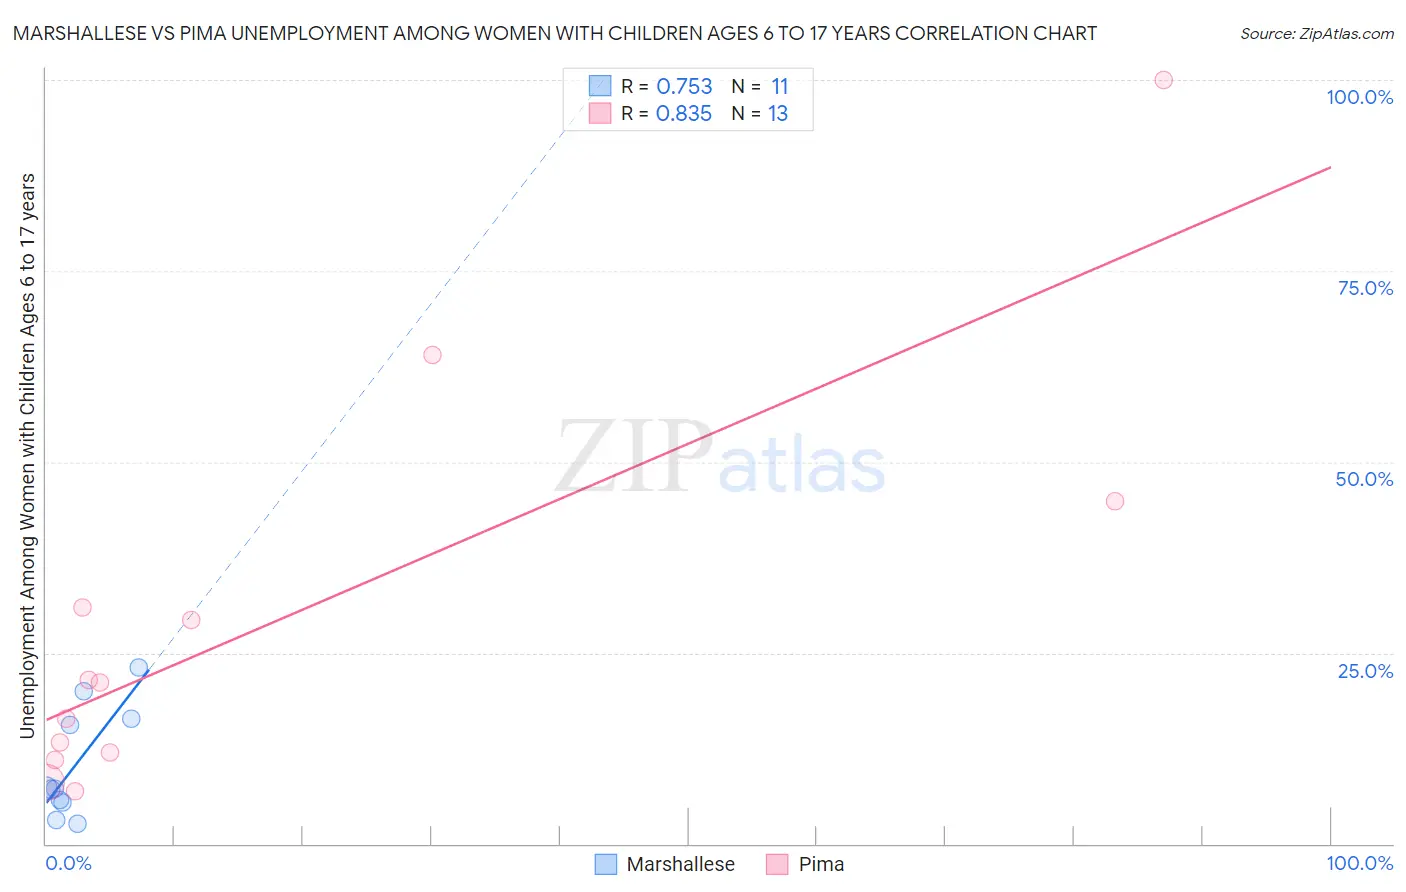
Marshallese vs Pima Unemployment Among Women with Children Ages 6 to 17 years Correlation Chart
The statistical analysis conducted on geographies consisting of 13,266,761 people shows a strong positive correlation between the proportion of Marshallese and unemployment rate among women with children between the ages 6 and 17 in the United States with a correlation coefficient (R) of 0.753 and weighted average of 8.3%. Similarly, the statistical analysis conducted on geographies consisting of 57,470,854 people shows a very strong positive correlation between the proportion of Pima and unemployment rate among women with children between the ages 6 and 17 in the United States with a correlation coefficient (R) of 0.835 and weighted average of 18.9%, a difference of 127.3%.
Unemployment Among Women with Children Ages 6 to 17 years Correlation Summary
| Measurement | Marshallese | Pima |
| Minimum | 2.7% | 6.8% |
| Maximum | 23.1% | 100.0% |
| Range | 20.4% | 93.2% |
| Mean | 10.3% | 29.2% |
| Median | 7.2% | 21.2% |
| Interquartile 25% (IQ1) | 5.4% | 11.5% |
| Interquartile 75% (IQ3) | 16.4% | 37.9% |
| Interquartile Range (IQR) | 11.0% | 26.4% |
| Standard Deviation (Sample) | 7.1% | 26.8% |
| Standard Deviation (Population) | 6.8% | 25.7% |
Similar Demographics by Unemployment Among Women with Children Ages 6 to 17 years
Demographics Similar to Marshallese by Unemployment Among Women with Children Ages 6 to 17 years
In terms of unemployment among women with children ages 6 to 17 years, the demographic groups most similar to Marshallese are Immigrants from Thailand (8.3%, a difference of 0.030%), Armenian (8.3%, a difference of 0.080%), Norwegian (8.3%, a difference of 0.11%), Luxembourger (8.3%, a difference of 0.18%), and Immigrants from Australia (8.3%, a difference of 0.18%).
| Demographics | Rating | Rank | Unemployment Among Women with Children Ages 6 to 17 years |
| Koreans | 100.0 /100 | #61 | Exceptional 8.2% |
| Spanish American Indians | 100.0 /100 | #62 | Exceptional 8.2% |
| Immigrants | South Eastern Asia | 99.9 /100 | #63 | Exceptional 8.2% |
| Immigrants | Kuwait | 99.9 /100 | #64 | Exceptional 8.3% |
| Immigrants | Albania | 99.9 /100 | #65 | Exceptional 8.3% |
| Luxembourgers | 99.9 /100 | #66 | Exceptional 8.3% |
| Armenians | 99.9 /100 | #67 | Exceptional 8.3% |
| Marshallese | 99.9 /100 | #68 | Exceptional 8.3% |
| Immigrants | Thailand | 99.9 /100 | #69 | Exceptional 8.3% |
| Norwegians | 99.9 /100 | #70 | Exceptional 8.3% |
| Immigrants | Australia | 99.8 /100 | #71 | Exceptional 8.3% |
| Immigrants | Nepal | 99.8 /100 | #72 | Exceptional 8.3% |
| Spanish Americans | 99.8 /100 | #73 | Exceptional 8.4% |
| Samoans | 99.7 /100 | #74 | Exceptional 8.4% |
| Immigrants | Sri Lanka | 99.7 /100 | #75 | Exceptional 8.4% |
Demographics Similar to Pima by Unemployment Among Women with Children Ages 6 to 17 years
In terms of unemployment among women with children ages 6 to 17 years, the demographic groups most similar to Pima are Yup'ik (18.6%, a difference of 1.4%), Arapaho (16.8%, a difference of 12.0%), Cheyenne (16.4%, a difference of 15.2%), Inupiat (14.9%, a difference of 27.1%), and Yuman (14.8%, a difference of 27.5%).
| Demographics | Rating | Rank | Unemployment Among Women with Children Ages 6 to 17 years |
| Natives/Alaskans | 0.0 /100 | #333 | Tragic 11.5% |
| Ugandans | 0.0 /100 | #334 | Tragic 12.0% |
| Colville | 0.0 /100 | #335 | Tragic 12.3% |
| Houma | 0.0 /100 | #336 | Tragic 12.5% |
| Immigrants | Yemen | 0.0 /100 | #337 | Tragic 12.7% |
| Hopi | 0.0 /100 | #338 | Tragic 12.9% |
| Sioux | 0.0 /100 | #339 | Tragic 13.2% |
| Puerto Ricans | 0.0 /100 | #340 | Tragic 13.9% |
| Navajo | 0.0 /100 | #341 | Tragic 14.2% |
| Yuman | 0.0 /100 | #342 | Tragic 14.8% |
| Inupiat | 0.0 /100 | #343 | Tragic 14.9% |
| Cheyenne | 0.0 /100 | #344 | Tragic 16.4% |
| Arapaho | 0.0 /100 | #345 | Tragic 16.8% |
| Yup'ik | 0.0 /100 | #346 | Tragic 18.6% |
| Pima | 0.0 /100 | #347 | Tragic 18.9% |