European vs Immigrants from Germany Unemployment Among Women with Children Ages 6 to 17 years
COMPARE
European
Immigrants from Germany
Unemployment Among Women with Children Ages 6 to 17 years
Unemployment Among Women with Children Ages 6 to 17 years Comparison
Europeans
Immigrants from Germany
8.7%
UNEMPLOYMENT AMONG WOMEN WITH CHILDREN AGES 6 TO 17 YEARS
90.6/ 100
METRIC RATING
135th/ 347
METRIC RANK
9.2%
UNEMPLOYMENT AMONG WOMEN WITH CHILDREN AGES 6 TO 17 YEARS
7.2/ 100
METRIC RATING
215th/ 347
METRIC RANK
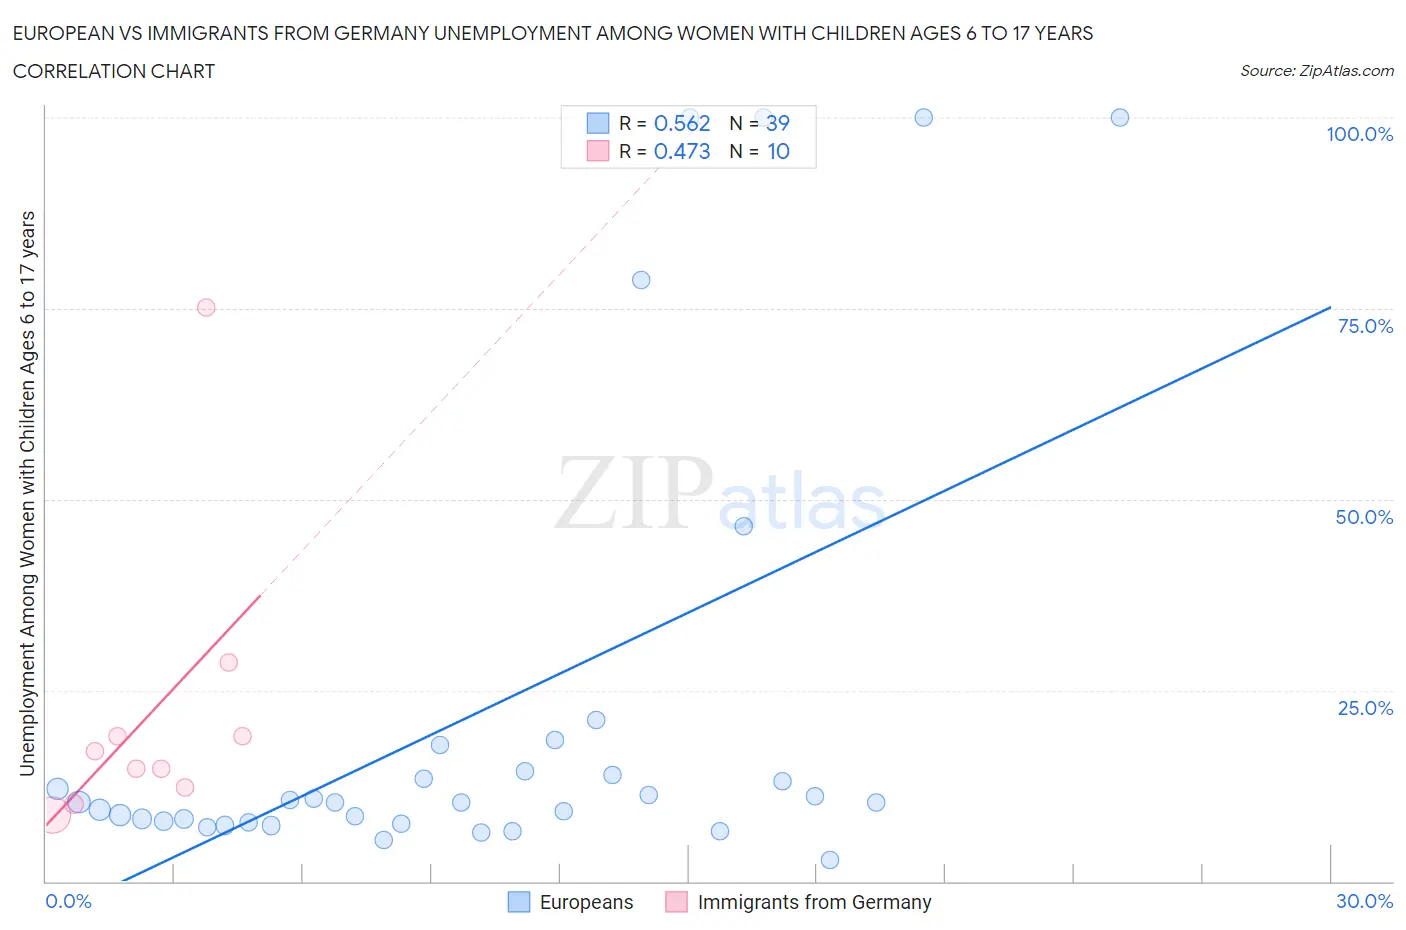
European vs Immigrants from Germany Unemployment Among Women with Children Ages 6 to 17 years Correlation Chart
The statistical analysis conducted on geographies consisting of 354,477,145 people shows a substantial positive correlation between the proportion of Europeans and unemployment rate among women with children between the ages 6 and 17 in the United States with a correlation coefficient (R) of 0.562 and weighted average of 8.7%. Similarly, the statistical analysis conducted on geographies consisting of 317,293,448 people shows a moderate positive correlation between the proportion of Immigrants from Germany and unemployment rate among women with children between the ages 6 and 17 in the United States with a correlation coefficient (R) of 0.473 and weighted average of 9.2%, a difference of 5.5%.
Unemployment Among Women with Children Ages 6 to 17 years Correlation Summary
| Measurement | European | Immigrants from Germany |
| Minimum | 2.8% | 8.7% |
| Maximum | 100.0% | 75.1% |
| Range | 97.2% | 66.3% |
| Mean | 22.0% | 21.9% |
| Median | 10.3% | 15.9% |
| Interquartile 25% (IQ1) | 7.7% | 12.3% |
| Interquartile 75% (IQ3) | 14.4% | 19.0% |
| Interquartile Range (IQR) | 6.7% | 6.7% |
| Standard Deviation (Sample) | 29.6% | 19.5% |
| Standard Deviation (Population) | 29.2% | 18.5% |
Similar Demographics by Unemployment Among Women with Children Ages 6 to 17 years
Demographics Similar to Europeans by Unemployment Among Women with Children Ages 6 to 17 years
In terms of unemployment among women with children ages 6 to 17 years, the demographic groups most similar to Europeans are Immigrants from Latvia (8.7%, a difference of 0.030%), Immigrants from Ireland (8.7%, a difference of 0.060%), Immigrants from Argentina (8.7%, a difference of 0.080%), Immigrants from Ethiopia (8.8%, a difference of 0.14%), and Egyptian (8.7%, a difference of 0.17%).
| Demographics | Rating | Rank | Unemployment Among Women with Children Ages 6 to 17 years |
| Hmong | 94.3 /100 | #128 | Exceptional 8.7% |
| Barbadians | 93.8 /100 | #129 | Exceptional 8.7% |
| Immigrants | Western Asia | 93.1 /100 | #130 | Exceptional 8.7% |
| Slavs | 92.2 /100 | #131 | Exceptional 8.7% |
| Yaqui | 92.2 /100 | #132 | Exceptional 8.7% |
| Egyptians | 91.8 /100 | #133 | Exceptional 8.7% |
| Immigrants | Ireland | 91.0 /100 | #134 | Exceptional 8.7% |
| Europeans | 90.6 /100 | #135 | Exceptional 8.7% |
| Immigrants | Latvia | 90.4 /100 | #136 | Exceptional 8.7% |
| Immigrants | Argentina | 90.0 /100 | #137 | Excellent 8.7% |
| Immigrants | Ethiopia | 89.5 /100 | #138 | Excellent 8.8% |
| Northern Europeans | 89.2 /100 | #139 | Excellent 8.8% |
| Immigrants | Poland | 88.3 /100 | #140 | Excellent 8.8% |
| Serbians | 87.6 /100 | #141 | Excellent 8.8% |
| Immigrants | Austria | 87.5 /100 | #142 | Excellent 8.8% |
Demographics Similar to Immigrants from Germany by Unemployment Among Women with Children Ages 6 to 17 years
In terms of unemployment among women with children ages 6 to 17 years, the demographic groups most similar to Immigrants from Germany are Immigrants from Uruguay (9.2%, a difference of 0.0%), German (9.2%, a difference of 0.010%), Iroquois (9.2%, a difference of 0.040%), Syrian (9.2%, a difference of 0.060%), and Immigrants from Scotland (9.2%, a difference of 0.11%).
| Demographics | Rating | Rank | Unemployment Among Women with Children Ages 6 to 17 years |
| Immigrants | Peru | 10.8 /100 | #208 | Poor 9.2% |
| Salvadorans | 10.7 /100 | #209 | Poor 9.2% |
| Finns | 10.0 /100 | #210 | Tragic 9.2% |
| Immigrants | Cuba | 9.6 /100 | #211 | Tragic 9.2% |
| Peruvians | 9.0 /100 | #212 | Tragic 9.2% |
| Spaniards | 8.2 /100 | #213 | Tragic 9.2% |
| Iroquois | 7.5 /100 | #214 | Tragic 9.2% |
| Immigrants | Germany | 7.2 /100 | #215 | Tragic 9.2% |
| Immigrants | Uruguay | 7.2 /100 | #216 | Tragic 9.2% |
| Germans | 7.2 /100 | #217 | Tragic 9.2% |
| Syrians | 6.9 /100 | #218 | Tragic 9.2% |
| Immigrants | Scotland | 6.6 /100 | #219 | Tragic 9.2% |
| Belgians | 6.4 /100 | #220 | Tragic 9.2% |
| Crow | 5.8 /100 | #221 | Tragic 9.2% |
| Immigrants | Southern Europe | 5.8 /100 | #222 | Tragic 9.2% |