Sudanese vs Immigrants from Albania Births to Unmarried Women
COMPARE
Sudanese
Immigrants from Albania
Births to Unmarried Women
Births to Unmarried Women Comparison
Sudanese
Immigrants from Albania
32.4%
BIRTHS TO UNMARRIED WOMEN
27.3/ 100
METRIC RATING
194th/ 347
METRIC RANK
28.0%
BIRTHS TO UNMARRIED WOMEN
99.2/ 100
METRIC RATING
58th/ 347
METRIC RANK
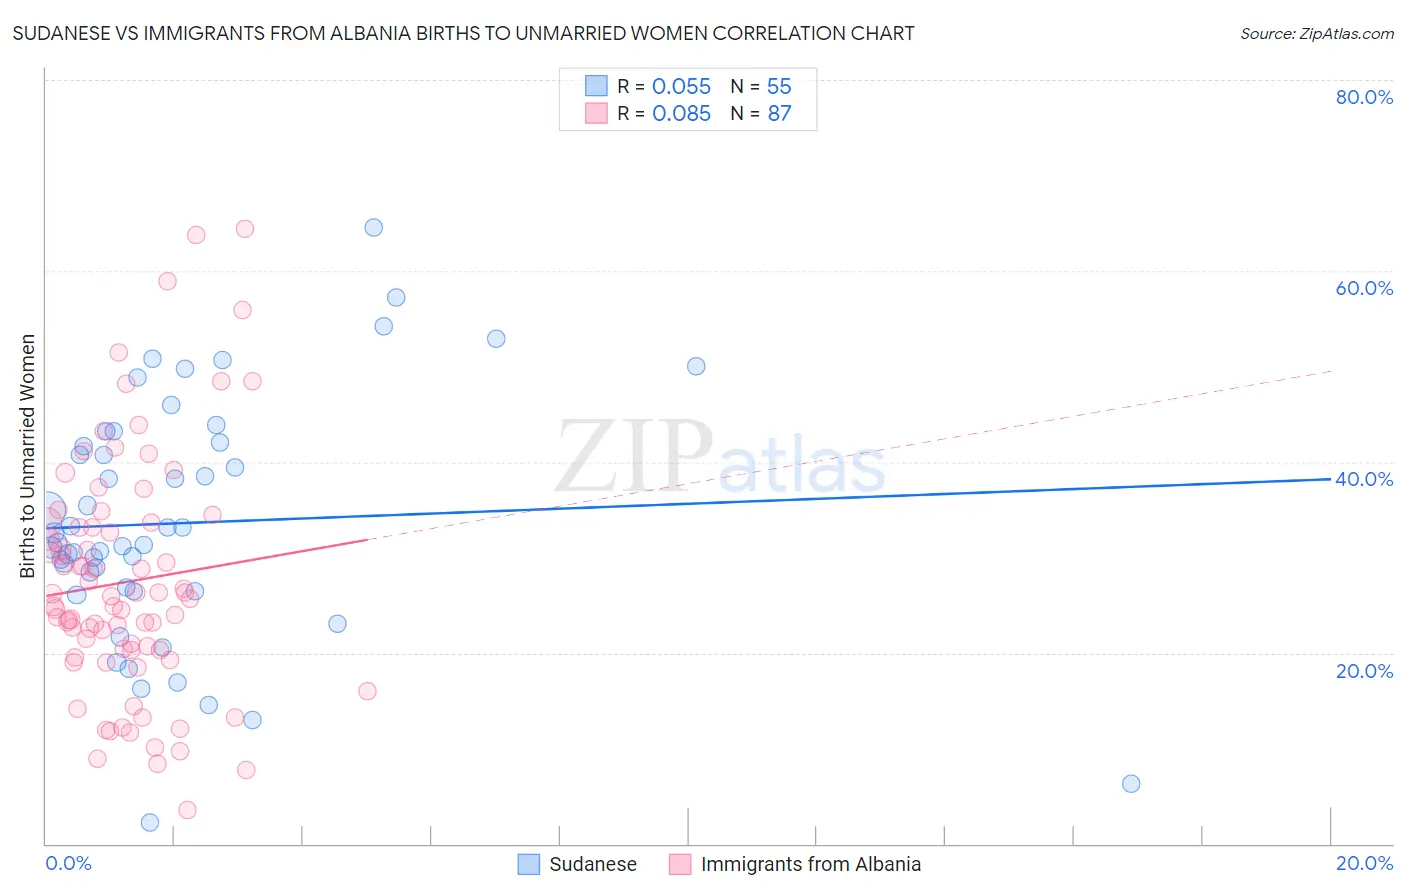
Sudanese vs Immigrants from Albania Births to Unmarried Women Correlation Chart
The statistical analysis conducted on geographies consisting of 107,881,308 people shows a slight positive correlation between the proportion of Sudanese and percentage of births to unmarried women in the United States with a correlation coefficient (R) of 0.055 and weighted average of 32.4%. Similarly, the statistical analysis conducted on geographies consisting of 114,601,314 people shows a slight positive correlation between the proportion of Immigrants from Albania and percentage of births to unmarried women in the United States with a correlation coefficient (R) of 0.085 and weighted average of 28.0%, a difference of 15.5%.
Births to Unmarried Women Correlation Summary
| Measurement | Sudanese | Immigrants from Albania |
| Minimum | 2.2% | 3.6% |
| Maximum | 64.6% | 64.4% |
| Range | 62.4% | 60.8% |
| Mean | 33.6% | 27.4% |
| Median | 31.5% | 25.6% |
| Interquartile 25% (IQ1) | 26.5% | 20.3% |
| Interquartile 75% (IQ3) | 42.0% | 33.6% |
| Interquartile Range (IQR) | 15.5% | 13.3% |
| Standard Deviation (Sample) | 12.8% | 12.6% |
| Standard Deviation (Population) | 12.6% | 12.5% |
Similar Demographics by Births to Unmarried Women
Demographics Similar to Sudanese by Births to Unmarried Women
In terms of births to unmarried women, the demographic groups most similar to Sudanese are Fijian (32.3%, a difference of 0.42%), Colombian (32.2%, a difference of 0.51%), Irish (32.2%, a difference of 0.57%), Tlingit-Haida (32.2%, a difference of 0.59%), and Samoan (32.6%, a difference of 0.67%).
| Demographics | Rating | Rank | Births to Unmarried Women |
| Czechoslovakians | 38.0 /100 | #187 | Fair 32.0% |
| Osage | 37.1 /100 | #188 | Fair 32.1% |
| Immigrants | Kenya | 36.9 /100 | #189 | Fair 32.1% |
| Tlingit-Haida | 32.6 /100 | #190 | Fair 32.2% |
| Irish | 32.4 /100 | #191 | Fair 32.2% |
| Colombians | 31.9 /100 | #192 | Fair 32.2% |
| Fijians | 31.1 /100 | #193 | Fair 32.3% |
| Sudanese | 27.3 /100 | #194 | Fair 32.4% |
| Samoans | 21.9 /100 | #195 | Fair 32.6% |
| Immigrants | Colombia | 21.7 /100 | #196 | Fair 32.6% |
| Immigrants | Immigrants | 20.6 /100 | #197 | Fair 32.7% |
| Costa Ricans | 20.3 /100 | #198 | Fair 32.7% |
| Immigrants | Thailand | 18.9 /100 | #199 | Poor 32.8% |
| Immigrants | Germany | 18.8 /100 | #200 | Poor 32.8% |
| Immigrants | Burma/Myanmar | 16.7 /100 | #201 | Poor 32.9% |
Demographics Similar to Immigrants from Albania by Births to Unmarried Women
In terms of births to unmarried women, the demographic groups most similar to Immigrants from Albania are Russian (28.0%, a difference of 0.11%), Immigrants from Belgium (28.0%, a difference of 0.24%), Immigrants from Kazakhstan (28.1%, a difference of 0.25%), Immigrants from Turkey (28.1%, a difference of 0.29%), and Immigrants from North Macedonia (28.1%, a difference of 0.34%).
| Demographics | Rating | Rank | Births to Unmarried Women |
| Macedonians | 99.4 /100 | #51 | Exceptional 27.9% |
| Bhutanese | 99.4 /100 | #52 | Exceptional 27.9% |
| Immigrants | Romania | 99.4 /100 | #53 | Exceptional 27.9% |
| Afghans | 99.4 /100 | #54 | Exceptional 27.9% |
| Mongolians | 99.3 /100 | #55 | Exceptional 27.9% |
| Immigrants | Belgium | 99.3 /100 | #56 | Exceptional 28.0% |
| Russians | 99.2 /100 | #57 | Exceptional 28.0% |
| Immigrants | Albania | 99.2 /100 | #58 | Exceptional 28.0% |
| Immigrants | Kazakhstan | 99.1 /100 | #59 | Exceptional 28.1% |
| Immigrants | Turkey | 99.1 /100 | #60 | Exceptional 28.1% |
| Immigrants | North Macedonia | 99.1 /100 | #61 | Exceptional 28.1% |
| Egyptians | 99.0 /100 | #62 | Exceptional 28.2% |
| Immigrants | Serbia | 98.9 /100 | #63 | Exceptional 28.3% |
| Tongans | 98.8 /100 | #64 | Exceptional 28.4% |
| Immigrants | Czechoslovakia | 98.8 /100 | #65 | Exceptional 28.4% |