Sudanese vs Belgian Unemployment
COMPARE
Sudanese
Belgian
Unemployment
Unemployment Comparison
Sudanese
Belgians
4.8%
UNEMPLOYMENT
99.8/ 100
METRIC RATING
33rd/ 347
METRIC RANK
4.6%
UNEMPLOYMENT
100.0/ 100
METRIC RATING
13th/ 347
METRIC RANK
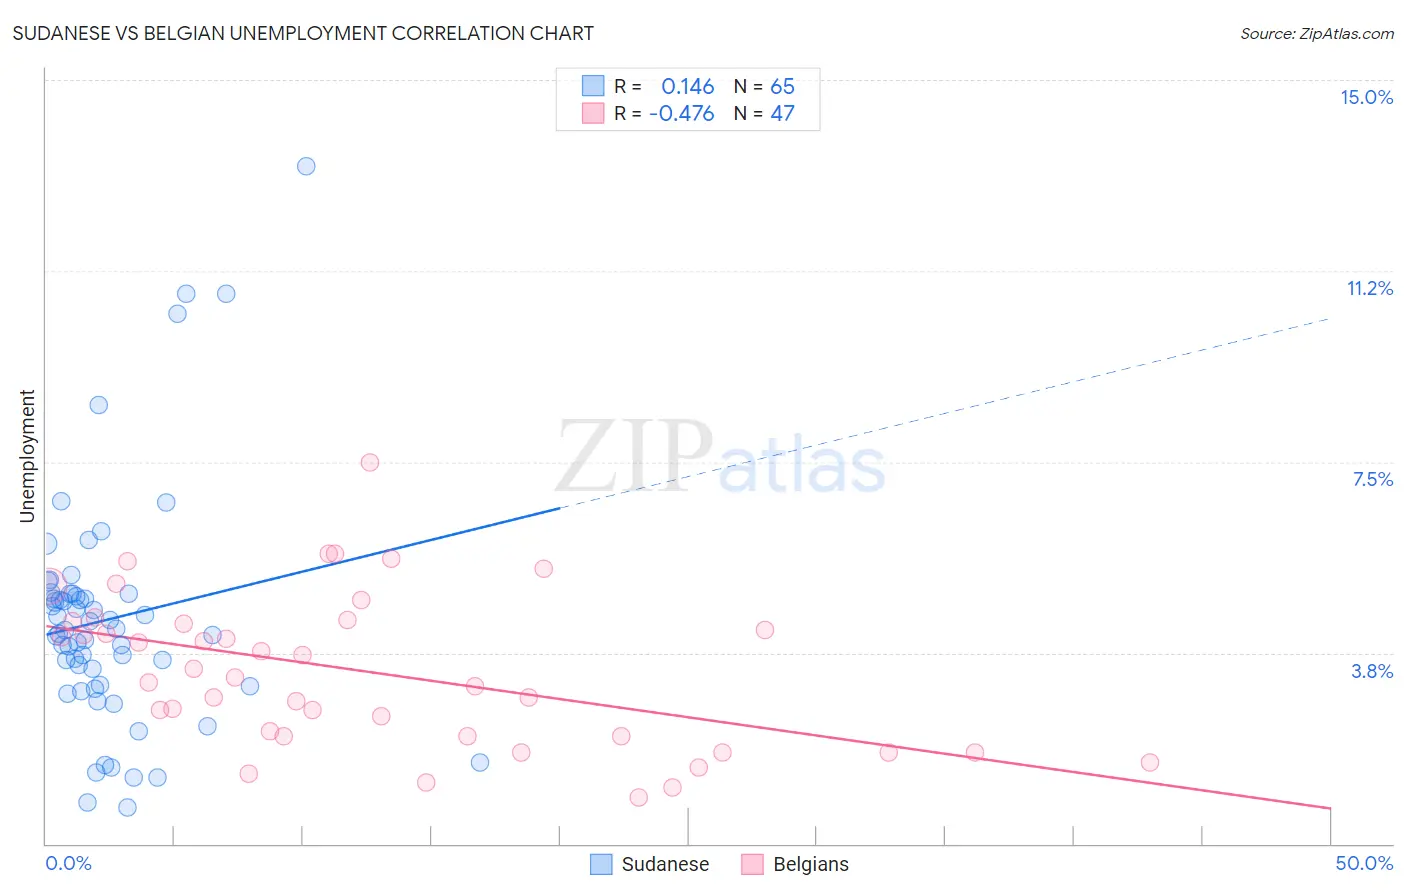
Sudanese vs Belgian Unemployment Correlation Chart
The statistical analysis conducted on geographies consisting of 110,101,890 people shows a poor positive correlation between the proportion of Sudanese and unemployment in the United States with a correlation coefficient (R) of 0.146 and weighted average of 4.8%. Similarly, the statistical analysis conducted on geographies consisting of 355,448,052 people shows a moderate negative correlation between the proportion of Belgians and unemployment in the United States with a correlation coefficient (R) of -0.476 and weighted average of 4.6%, a difference of 3.2%.
Unemployment Correlation Summary
| Measurement | Sudanese | Belgian |
| Minimum | 0.70% | 0.90% |
| Maximum | 13.3% | 7.5% |
| Range | 12.6% | 6.6% |
| Mean | 4.4% | 3.4% |
| Median | 4.2% | 3.3% |
| Interquartile 25% (IQ1) | 3.1% | 2.1% |
| Interquartile 75% (IQ3) | 4.9% | 4.4% |
| Interquartile Range (IQR) | 1.8% | 2.3% |
| Standard Deviation (Sample) | 2.3% | 1.5% |
| Standard Deviation (Population) | 2.3% | 1.5% |
Demographics Similar to Sudanese and Belgians by Unemployment
In terms of unemployment, the demographic groups most similar to Sudanese are Zimbabwean (4.8%, a difference of 0.010%), Croatian (4.8%, a difference of 0.11%), Irish (4.8%, a difference of 0.13%), Polish (4.7%, a difference of 0.37%), and Cuban (4.7%, a difference of 0.49%). Similarly, the demographic groups most similar to Belgians are Immigrants from Cuba (4.6%, a difference of 0.24%), European (4.6%, a difference of 0.72%), Chinese (4.7%, a difference of 0.86%), Slovene (4.7%, a difference of 0.96%), and Immigrants from Venezuela (4.7%, a difference of 0.99%).
| Demographics | Rating | Rank | Unemployment |
| Belgians | 100.0 /100 | #13 | Exceptional 4.6% |
| Immigrants | Cuba | 100.0 /100 | #14 | Exceptional 4.6% |
| Europeans | 99.9 /100 | #15 | Exceptional 4.6% |
| Chinese | 99.9 /100 | #16 | Exceptional 4.7% |
| Slovenes | 99.9 /100 | #17 | Exceptional 4.7% |
| Immigrants | Venezuela | 99.9 /100 | #18 | Exceptional 4.7% |
| Scottish | 99.9 /100 | #19 | Exceptional 4.7% |
| Carpatho Rusyns | 99.9 /100 | #20 | Exceptional 4.7% |
| Welsh | 99.9 /100 | #21 | Exceptional 4.7% |
| Thais | 99.9 /100 | #22 | Exceptional 4.7% |
| British | 99.9 /100 | #23 | Exceptional 4.7% |
| Venezuelans | 99.9 /100 | #24 | Exceptional 4.7% |
| Latvians | 99.9 /100 | #25 | Exceptional 4.7% |
| Bulgarians | 99.9 /100 | #26 | Exceptional 4.7% |
| Finns | 99.9 /100 | #27 | Exceptional 4.7% |
| Cubans | 99.8 /100 | #28 | Exceptional 4.7% |
| Poles | 99.8 /100 | #29 | Exceptional 4.7% |
| Irish | 99.8 /100 | #30 | Exceptional 4.8% |
| Croatians | 99.8 /100 | #31 | Exceptional 4.8% |
| Zimbabweans | 99.8 /100 | #32 | Exceptional 4.8% |
| Sudanese | 99.8 /100 | #33 | Exceptional 4.8% |