Sudanese vs Swiss Unemployment
COMPARE
Sudanese
Swiss
Unemployment
Unemployment Comparison
Sudanese
Swiss
4.8%
UNEMPLOYMENT
99.8/ 100
METRIC RATING
33rd/ 347
METRIC RANK
4.5%
UNEMPLOYMENT
100.0/ 100
METRIC RATING
8th/ 347
METRIC RANK
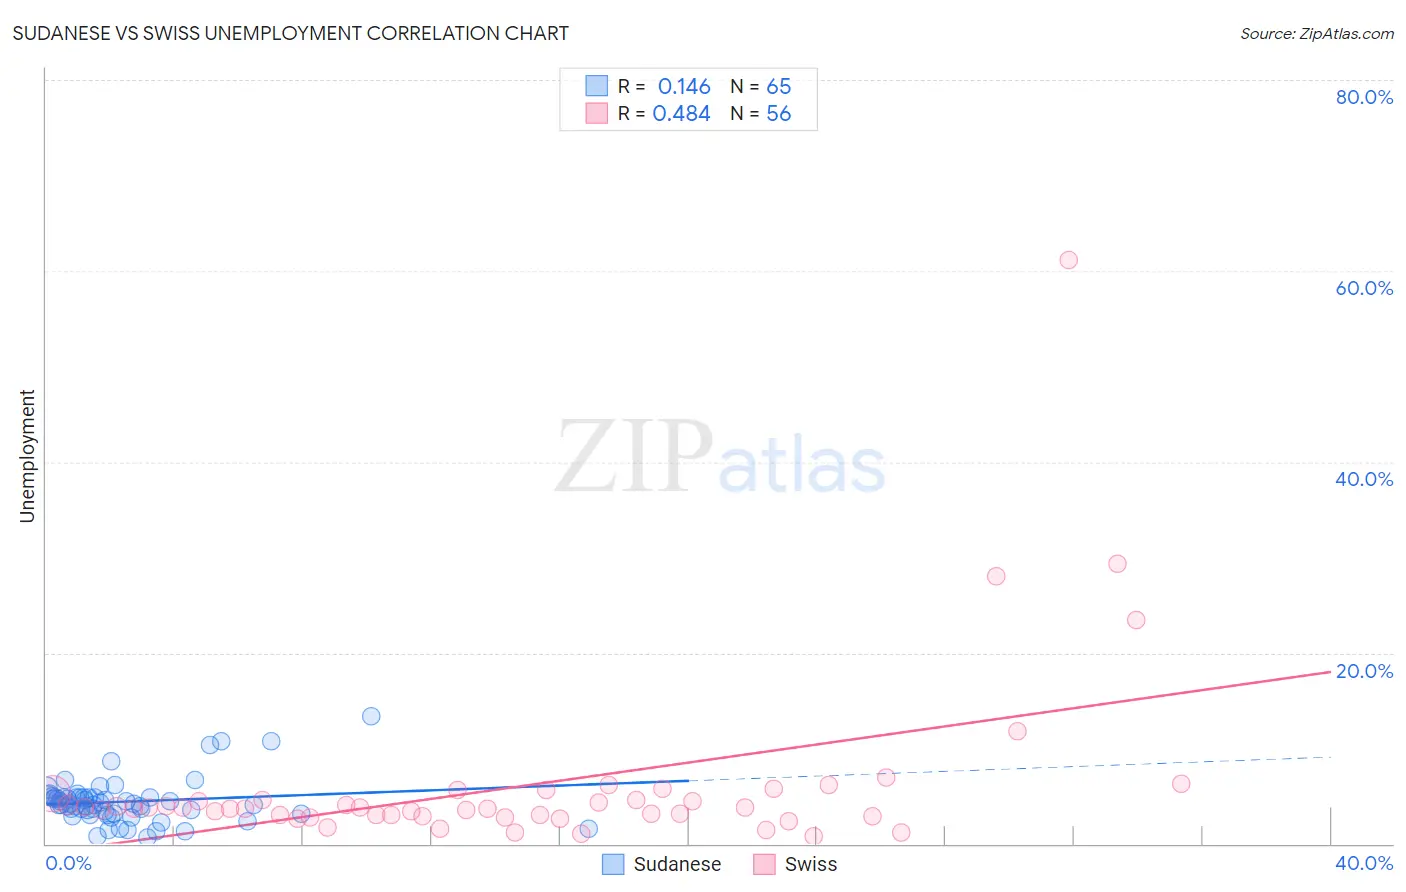
Sudanese vs Swiss Unemployment Correlation Chart
The statistical analysis conducted on geographies consisting of 110,101,890 people shows a poor positive correlation between the proportion of Sudanese and unemployment in the United States with a correlation coefficient (R) of 0.146 and weighted average of 4.8%. Similarly, the statistical analysis conducted on geographies consisting of 463,573,695 people shows a moderate positive correlation between the proportion of Swiss and unemployment in the United States with a correlation coefficient (R) of 0.484 and weighted average of 4.5%, a difference of 5.1%.
Unemployment Correlation Summary
| Measurement | Sudanese | Swiss |
| Minimum | 0.70% | 0.84% |
| Maximum | 13.3% | 61.1% |
| Range | 12.6% | 60.3% |
| Mean | 4.4% | 6.1% |
| Median | 4.2% | 3.7% |
| Interquartile 25% (IQ1) | 3.1% | 2.9% |
| Interquartile 75% (IQ3) | 4.9% | 4.9% |
| Interquartile Range (IQR) | 1.8% | 1.9% |
| Standard Deviation (Sample) | 2.3% | 9.3% |
| Standard Deviation (Population) | 2.3% | 9.2% |
Similar Demographics by Unemployment
Demographics Similar to Sudanese by Unemployment
In terms of unemployment, the demographic groups most similar to Sudanese are Zimbabwean (4.8%, a difference of 0.010%), Immigrants from Bolivia (4.8%, a difference of 0.040%), Croatian (4.8%, a difference of 0.11%), Scotch-Irish (4.8%, a difference of 0.11%), and Irish (4.8%, a difference of 0.13%).
| Demographics | Rating | Rank | Unemployment |
| Bulgarians | 99.9 /100 | #26 | Exceptional 4.7% |
| Finns | 99.9 /100 | #27 | Exceptional 4.7% |
| Cubans | 99.8 /100 | #28 | Exceptional 4.7% |
| Poles | 99.8 /100 | #29 | Exceptional 4.7% |
| Irish | 99.8 /100 | #30 | Exceptional 4.8% |
| Croatians | 99.8 /100 | #31 | Exceptional 4.8% |
| Zimbabweans | 99.8 /100 | #32 | Exceptional 4.8% |
| Sudanese | 99.8 /100 | #33 | Exceptional 4.8% |
| Immigrants | Bolivia | 99.8 /100 | #34 | Exceptional 4.8% |
| Scotch-Irish | 99.8 /100 | #35 | Exceptional 4.8% |
| Tongans | 99.7 /100 | #36 | Exceptional 4.8% |
| Czechoslovakians | 99.7 /100 | #37 | Exceptional 4.8% |
| Bolivians | 99.7 /100 | #38 | Exceptional 4.8% |
| Lithuanians | 99.7 /100 | #39 | Exceptional 4.8% |
| Northern Europeans | 99.7 /100 | #40 | Exceptional 4.8% |
Demographics Similar to Swiss by Unemployment
In terms of unemployment, the demographic groups most similar to Swiss are Scandinavian (4.5%, a difference of 0.39%), Immigrants from India (4.5%, a difference of 0.46%), Dutch (4.6%, a difference of 0.90%), German (4.5%, a difference of 1.0%), and English (4.6%, a difference of 1.6%).
| Demographics | Rating | Rank | Unemployment |
| Norwegians | 100.0 /100 | #1 | Exceptional 4.2% |
| Luxembourgers | 100.0 /100 | #2 | Exceptional 4.3% |
| Czechs | 100.0 /100 | #3 | Exceptional 4.3% |
| Danes | 100.0 /100 | #4 | Exceptional 4.3% |
| Swedes | 100.0 /100 | #5 | Exceptional 4.4% |
| Germans | 100.0 /100 | #6 | Exceptional 4.5% |
| Immigrants | India | 100.0 /100 | #7 | Exceptional 4.5% |
| Swiss | 100.0 /100 | #8 | Exceptional 4.5% |
| Scandinavians | 100.0 /100 | #9 | Exceptional 4.5% |
| Dutch | 100.0 /100 | #10 | Exceptional 4.6% |
| English | 100.0 /100 | #11 | Exceptional 4.6% |
| Pennsylvania Germans | 100.0 /100 | #12 | Exceptional 4.6% |
| Belgians | 100.0 /100 | #13 | Exceptional 4.6% |
| Immigrants | Cuba | 100.0 /100 | #14 | Exceptional 4.6% |
| Europeans | 99.9 /100 | #15 | Exceptional 4.6% |