Sudanese vs Immigrants from Iran Unemployment
COMPARE
Sudanese
Immigrants from Iran
Unemployment
Unemployment Comparison
Sudanese
Immigrants from Iran
4.8%
UNEMPLOYMENT
99.8/ 100
METRIC RATING
33rd/ 347
METRIC RANK
5.4%
UNEMPLOYMENT
18.8/ 100
METRIC RATING
209th/ 347
METRIC RANK
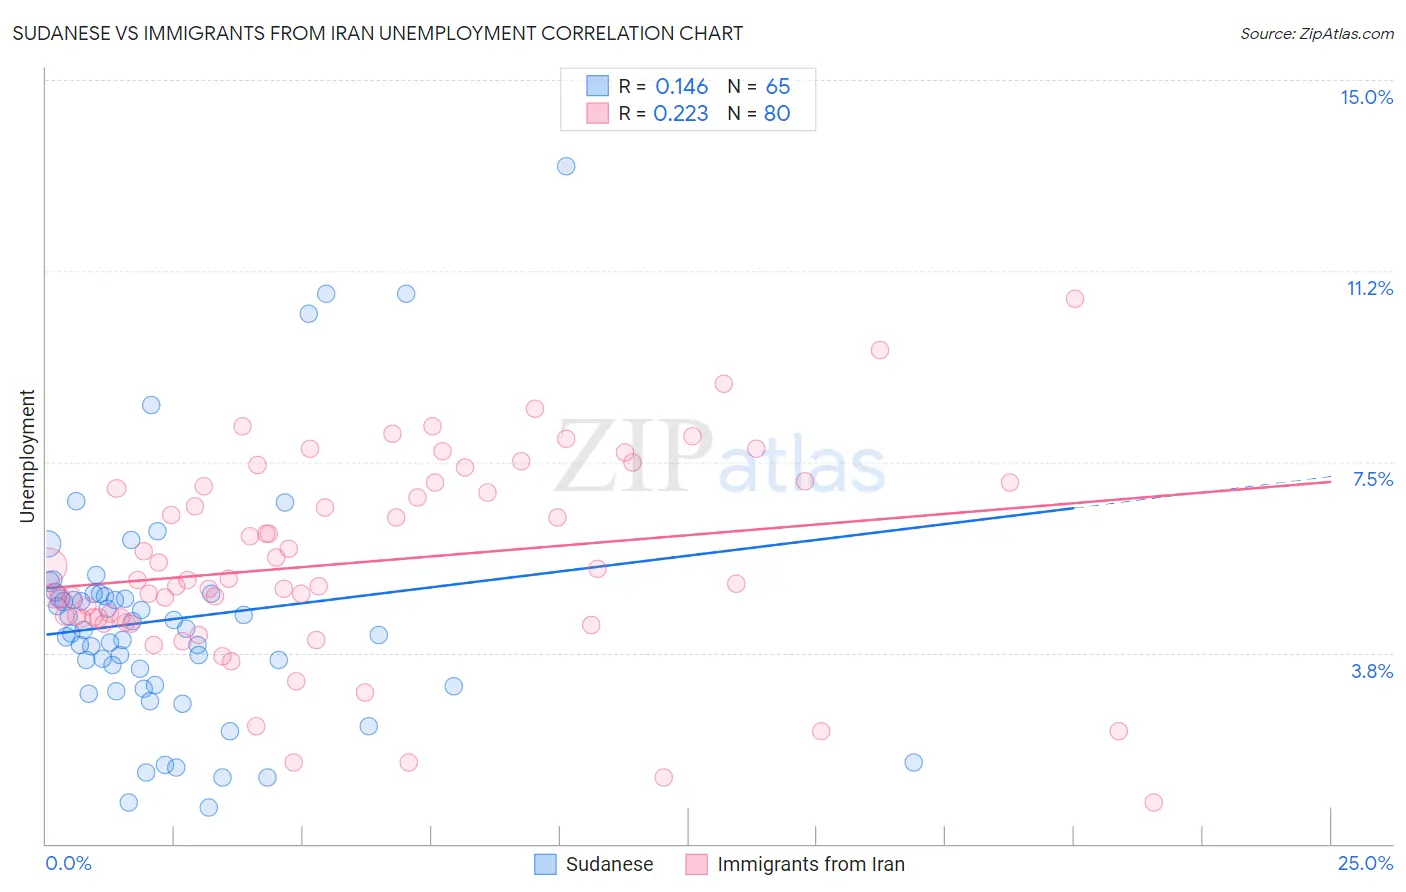
Sudanese vs Immigrants from Iran Unemployment Correlation Chart
The statistical analysis conducted on geographies consisting of 110,101,890 people shows a poor positive correlation between the proportion of Sudanese and unemployment in the United States with a correlation coefficient (R) of 0.146 and weighted average of 4.8%. Similarly, the statistical analysis conducted on geographies consisting of 279,810,569 people shows a weak positive correlation between the proportion of Immigrants from Iran and unemployment in the United States with a correlation coefficient (R) of 0.223 and weighted average of 5.4%, a difference of 12.9%.
Unemployment Correlation Summary
| Measurement | Sudanese | Immigrants from Iran |
| Minimum | 0.70% | 0.80% |
| Maximum | 13.3% | 10.7% |
| Range | 12.6% | 9.9% |
| Mean | 4.4% | 5.5% |
| Median | 4.2% | 5.2% |
| Interquartile 25% (IQ1) | 3.1% | 4.4% |
| Interquartile 75% (IQ3) | 4.9% | 7.1% |
| Interquartile Range (IQR) | 1.8% | 2.6% |
| Standard Deviation (Sample) | 2.3% | 2.0% |
| Standard Deviation (Population) | 2.3% | 2.0% |
Similar Demographics by Unemployment
Demographics Similar to Sudanese by Unemployment
In terms of unemployment, the demographic groups most similar to Sudanese are Zimbabwean (4.8%, a difference of 0.010%), Immigrants from Bolivia (4.8%, a difference of 0.040%), Croatian (4.8%, a difference of 0.11%), Scotch-Irish (4.8%, a difference of 0.11%), and Irish (4.8%, a difference of 0.13%).
| Demographics | Rating | Rank | Unemployment |
| Bulgarians | 99.9 /100 | #26 | Exceptional 4.7% |
| Finns | 99.9 /100 | #27 | Exceptional 4.7% |
| Cubans | 99.8 /100 | #28 | Exceptional 4.7% |
| Poles | 99.8 /100 | #29 | Exceptional 4.7% |
| Irish | 99.8 /100 | #30 | Exceptional 4.8% |
| Croatians | 99.8 /100 | #31 | Exceptional 4.8% |
| Zimbabweans | 99.8 /100 | #32 | Exceptional 4.8% |
| Sudanese | 99.8 /100 | #33 | Exceptional 4.8% |
| Immigrants | Bolivia | 99.8 /100 | #34 | Exceptional 4.8% |
| Scotch-Irish | 99.8 /100 | #35 | Exceptional 4.8% |
| Tongans | 99.7 /100 | #36 | Exceptional 4.8% |
| Czechoslovakians | 99.7 /100 | #37 | Exceptional 4.8% |
| Bolivians | 99.7 /100 | #38 | Exceptional 4.8% |
| Lithuanians | 99.7 /100 | #39 | Exceptional 4.8% |
| Northern Europeans | 99.7 /100 | #40 | Exceptional 4.8% |
Demographics Similar to Immigrants from Iran by Unemployment
In terms of unemployment, the demographic groups most similar to Immigrants from Iran are Immigrants from Iraq (5.4%, a difference of 0.020%), Portuguese (5.4%, a difference of 0.030%), Creek (5.4%, a difference of 0.060%), Iraqi (5.4%, a difference of 0.070%), and Ugandan (5.4%, a difference of 0.080%).
| Demographics | Rating | Rank | Unemployment |
| Cherokee | 25.5 /100 | #202 | Fair 5.3% |
| Immigrants | Micronesia | 25.2 /100 | #203 | Fair 5.3% |
| Immigrants | Ukraine | 24.9 /100 | #204 | Fair 5.3% |
| Native Hawaiians | 24.1 /100 | #205 | Fair 5.3% |
| Immigrants | Peru | 22.7 /100 | #206 | Fair 5.4% |
| Creek | 19.4 /100 | #207 | Poor 5.4% |
| Portuguese | 19.0 /100 | #208 | Poor 5.4% |
| Immigrants | Iran | 18.8 /100 | #209 | Poor 5.4% |
| Immigrants | Iraq | 18.6 /100 | #210 | Poor 5.4% |
| Iraqis | 18.1 /100 | #211 | Poor 5.4% |
| Ugandans | 18.0 /100 | #212 | Poor 5.4% |
| Immigrants | Middle Africa | 15.3 /100 | #213 | Poor 5.4% |
| Immigrants | Costa Rica | 15.2 /100 | #214 | Poor 5.4% |
| Delaware | 14.7 /100 | #215 | Poor 5.4% |
| Immigrants | South America | 13.5 /100 | #216 | Poor 5.4% |