Subsaharan African vs Immigrants from Iran In Labor Force | Age 35-44
COMPARE
Subsaharan African
Immigrants from Iran
In Labor Force | Age 35-44
In Labor Force | Age 35-44 Comparison
Sub-Saharan Africans
Immigrants from Iran
84.1%
IN LABOR FORCE | AGE 35-44
9.3/ 100
METRIC RATING
219th/ 347
METRIC RANK
84.4%
IN LABOR FORCE | AGE 35-44
50.0/ 100
METRIC RATING
174th/ 347
METRIC RANK
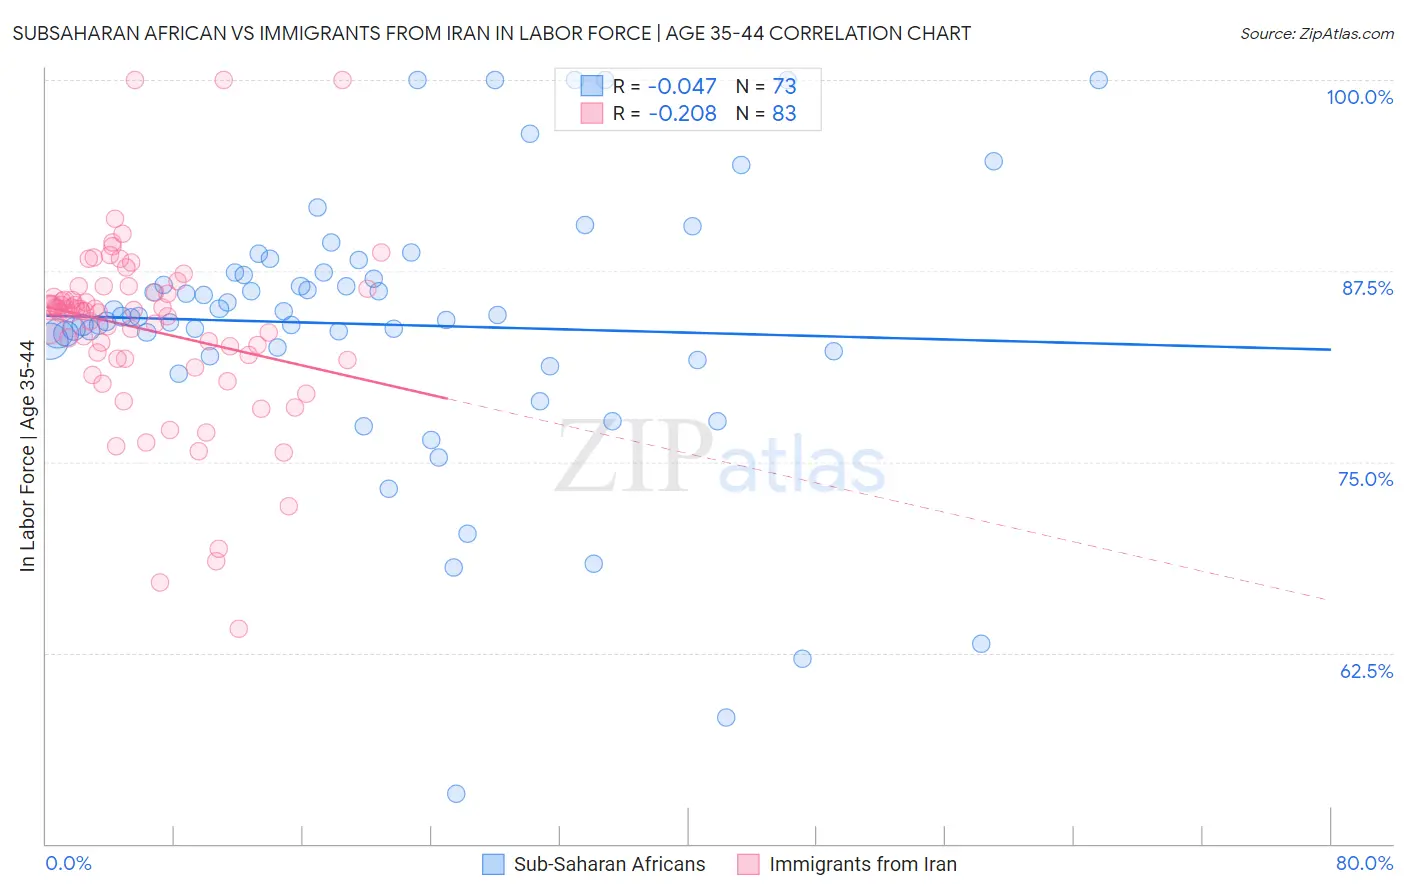
Subsaharan African vs Immigrants from Iran In Labor Force | Age 35-44 Correlation Chart
The statistical analysis conducted on geographies consisting of 507,706,438 people shows no correlation between the proportion of Sub-Saharan Africans and labor force participation rate among population between the ages 35 and 44 in the United States with a correlation coefficient (R) of -0.047 and weighted average of 84.1%. Similarly, the statistical analysis conducted on geographies consisting of 279,863,653 people shows a weak negative correlation between the proportion of Immigrants from Iran and labor force participation rate among population between the ages 35 and 44 in the United States with a correlation coefficient (R) of -0.208 and weighted average of 84.4%, a difference of 0.37%.
In Labor Force | Age 35-44 Correlation Summary
| Measurement | Subsaharan African | Immigrants from Iran |
| Minimum | 53.3% | 64.1% |
| Maximum | 100.0% | 100.0% |
| Range | 46.7% | 35.9% |
| Mean | 84.0% | 83.7% |
| Median | 84.5% | 84.9% |
| Interquartile 25% (IQ1) | 82.1% | 81.7% |
| Interquartile 75% (IQ3) | 87.4% | 86.1% |
| Interquartile Range (IQR) | 5.3% | 4.4% |
| Standard Deviation (Sample) | 9.1% | 6.0% |
| Standard Deviation (Population) | 9.0% | 5.9% |
Similar Demographics by In Labor Force | Age 35-44
Demographics Similar to Sub-Saharan Africans by In Labor Force | Age 35-44
In terms of in labor force | age 35-44, the demographic groups most similar to Sub-Saharan Africans are Immigrants from Nicaragua (84.1%, a difference of 0.0%), Immigrants from Norway (84.1%, a difference of 0.040%), French (84.0%, a difference of 0.040%), European (84.1%, a difference of 0.050%), and Nicaraguan (84.1%, a difference of 0.050%).
| Demographics | Rating | Rank | In Labor Force | Age 35-44 |
| Israelis | 14.0 /100 | #212 | Poor 84.1% |
| Bangladeshis | 13.7 /100 | #213 | Poor 84.1% |
| Immigrants | Barbados | 13.2 /100 | #214 | Poor 84.1% |
| Europeans | 12.2 /100 | #215 | Poor 84.1% |
| Nicaraguans | 12.1 /100 | #216 | Poor 84.1% |
| Immigrants | Norway | 11.7 /100 | #217 | Poor 84.1% |
| Immigrants | Nicaragua | 9.4 /100 | #218 | Tragic 84.1% |
| Sub-Saharan Africans | 9.3 /100 | #219 | Tragic 84.1% |
| French | 7.5 /100 | #220 | Tragic 84.0% |
| Icelanders | 6.7 /100 | #221 | Tragic 84.0% |
| Assyrians/Chaldeans/Syriacs | 6.6 /100 | #222 | Tragic 84.0% |
| Immigrants | Panama | 6.4 /100 | #223 | Tragic 84.0% |
| U.S. Virgin Islanders | 6.1 /100 | #224 | Tragic 84.0% |
| Immigrants | Burma/Myanmar | 6.1 /100 | #225 | Tragic 84.0% |
| Panamanians | 5.4 /100 | #226 | Tragic 84.0% |
Demographics Similar to Immigrants from Iran by In Labor Force | Age 35-44
In terms of in labor force | age 35-44, the demographic groups most similar to Immigrants from Iran are Immigrants from Trinidad and Tobago (84.4%, a difference of 0.0%), Jordanian (84.4%, a difference of 0.010%), Scandinavian (84.4%, a difference of 0.010%), Pakistani (84.4%, a difference of 0.010%), and Irish (84.4%, a difference of 0.020%).
| Demographics | Rating | Rank | In Labor Force | Age 35-44 |
| Immigrants | Portugal | 55.2 /100 | #167 | Average 84.4% |
| Irish | 53.1 /100 | #168 | Average 84.4% |
| Immigrants | Afghanistan | 52.7 /100 | #169 | Average 84.4% |
| Immigrants | Jordan | 52.5 /100 | #170 | Average 84.4% |
| Jordanians | 51.7 /100 | #171 | Average 84.4% |
| Scandinavians | 51.2 /100 | #172 | Average 84.4% |
| Immigrants | Trinidad and Tobago | 50.7 /100 | #173 | Average 84.4% |
| Immigrants | Iran | 50.0 /100 | #174 | Average 84.4% |
| Pakistanis | 48.2 /100 | #175 | Average 84.4% |
| Sri Lankans | 47.3 /100 | #176 | Average 84.4% |
| French Canadians | 44.3 /100 | #177 | Average 84.3% |
| Northern Europeans | 44.1 /100 | #178 | Average 84.3% |
| Immigrants | South Africa | 42.8 /100 | #179 | Average 84.3% |
| Danes | 38.8 /100 | #180 | Fair 84.3% |
| Immigrants | West Indies | 36.4 /100 | #181 | Fair 84.3% |