Paiute vs Immigrants from Iran Unemployment
COMPARE
Paiute
Immigrants from Iran
Unemployment
Unemployment Comparison
Paiute
Immigrants from Iran
7.1%
UNEMPLOYMENT
0.0/ 100
METRIC RATING
326th/ 347
METRIC RANK
5.4%
UNEMPLOYMENT
18.8/ 100
METRIC RATING
209th/ 347
METRIC RANK
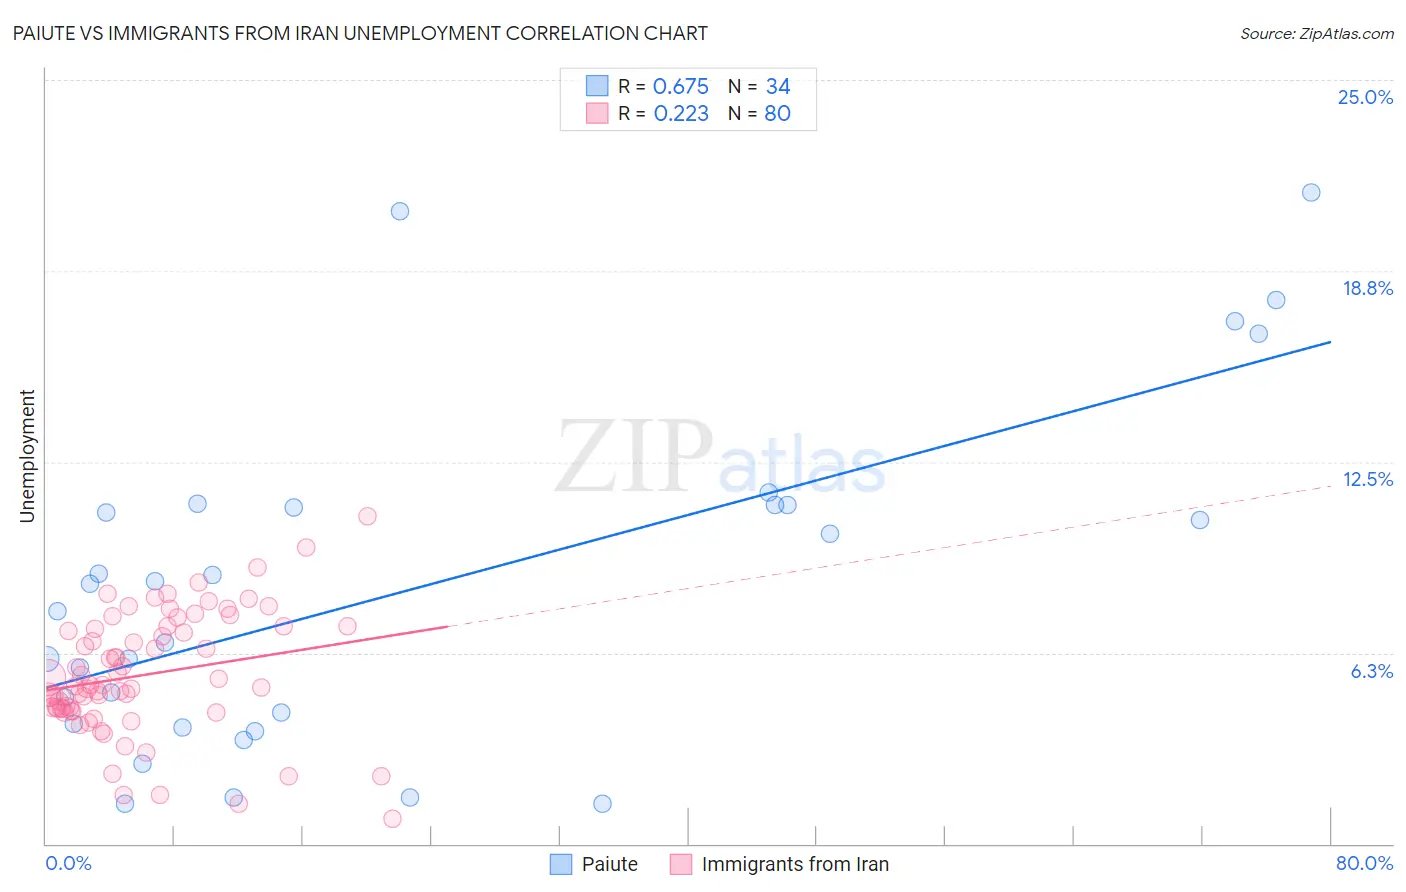
Paiute vs Immigrants from Iran Unemployment Correlation Chart
The statistical analysis conducted on geographies consisting of 58,375,117 people shows a significant positive correlation between the proportion of Paiute and unemployment in the United States with a correlation coefficient (R) of 0.675 and weighted average of 7.1%. Similarly, the statistical analysis conducted on geographies consisting of 279,810,569 people shows a weak positive correlation between the proportion of Immigrants from Iran and unemployment in the United States with a correlation coefficient (R) of 0.223 and weighted average of 5.4%, a difference of 32.3%.
Unemployment Correlation Summary
| Measurement | Paiute | Immigrants from Iran |
| Minimum | 1.3% | 0.80% |
| Maximum | 21.3% | 10.7% |
| Range | 20.0% | 9.9% |
| Mean | 8.4% | 5.5% |
| Median | 8.1% | 5.2% |
| Interquartile 25% (IQ1) | 3.9% | 4.4% |
| Interquartile 75% (IQ3) | 11.1% | 7.1% |
| Interquartile Range (IQR) | 7.2% | 2.6% |
| Standard Deviation (Sample) | 5.5% | 2.0% |
| Standard Deviation (Population) | 5.4% | 2.0% |
Similar Demographics by Unemployment
Demographics Similar to Paiute by Unemployment
In terms of unemployment, the demographic groups most similar to Paiute are Pueblo (7.2%, a difference of 0.53%), Native/Alaskan (7.0%, a difference of 1.1%), Tsimshian (7.2%, a difference of 1.4%), Immigrants from Armenia (7.0%, a difference of 1.7%), and Alaska Native (7.2%, a difference of 1.8%).
| Demographics | Rating | Rank | Unemployment |
| British West Indians | 0.0 /100 | #319 | Tragic 6.8% |
| Immigrants | St. Vincent and the Grenadines | 0.0 /100 | #320 | Tragic 6.9% |
| Immigrants | Guyana | 0.0 /100 | #321 | Tragic 6.9% |
| Guyanese | 0.0 /100 | #322 | Tragic 6.9% |
| Immigrants | Grenada | 0.0 /100 | #323 | Tragic 6.9% |
| Immigrants | Armenia | 0.0 /100 | #324 | Tragic 7.0% |
| Natives/Alaskans | 0.0 /100 | #325 | Tragic 7.0% |
| Paiute | 0.0 /100 | #326 | Tragic 7.1% |
| Pueblo | 0.0 /100 | #327 | Tragic 7.2% |
| Tsimshian | 0.0 /100 | #328 | Tragic 7.2% |
| Alaska Natives | 0.0 /100 | #329 | Tragic 7.2% |
| Yakama | 0.0 /100 | #330 | Tragic 7.3% |
| Dominicans | 0.0 /100 | #331 | Tragic 7.4% |
| Sioux | 0.0 /100 | #332 | Tragic 7.4% |
| Immigrants | Dominican Republic | 0.0 /100 | #333 | Tragic 7.4% |
Demographics Similar to Immigrants from Iran by Unemployment
In terms of unemployment, the demographic groups most similar to Immigrants from Iran are Immigrants from Iraq (5.4%, a difference of 0.020%), Portuguese (5.4%, a difference of 0.030%), Creek (5.4%, a difference of 0.060%), Iraqi (5.4%, a difference of 0.070%), and Ugandan (5.4%, a difference of 0.080%).
| Demographics | Rating | Rank | Unemployment |
| Cherokee | 25.5 /100 | #202 | Fair 5.3% |
| Immigrants | Micronesia | 25.2 /100 | #203 | Fair 5.3% |
| Immigrants | Ukraine | 24.9 /100 | #204 | Fair 5.3% |
| Native Hawaiians | 24.1 /100 | #205 | Fair 5.3% |
| Immigrants | Peru | 22.7 /100 | #206 | Fair 5.4% |
| Creek | 19.4 /100 | #207 | Poor 5.4% |
| Portuguese | 19.0 /100 | #208 | Poor 5.4% |
| Immigrants | Iran | 18.8 /100 | #209 | Poor 5.4% |
| Immigrants | Iraq | 18.6 /100 | #210 | Poor 5.4% |
| Iraqis | 18.1 /100 | #211 | Poor 5.4% |
| Ugandans | 18.0 /100 | #212 | Poor 5.4% |
| Immigrants | Middle Africa | 15.3 /100 | #213 | Poor 5.4% |
| Immigrants | Costa Rica | 15.2 /100 | #214 | Poor 5.4% |
| Delaware | 14.7 /100 | #215 | Poor 5.4% |
| Immigrants | South America | 13.5 /100 | #216 | Poor 5.4% |