Subsaharan African vs Immigrants from Burma/Myanmar Unemployment Among Ages 65 to 74 years
COMPARE
Subsaharan African
Immigrants from Burma/Myanmar
Unemployment Among Ages 65 to 74 years
Unemployment Among Ages 65 to 74 years Comparison
Sub-Saharan Africans
Immigrants from Burma/Myanmar
5.4%
UNEMPLOYMENT AMONG AGES 65 TO 74 YEARS
14.4/ 100
METRIC RATING
202nd/ 347
METRIC RANK
4.8%
UNEMPLOYMENT AMONG AGES 65 TO 74 YEARS
100.0/ 100
METRIC RATING
16th/ 347
METRIC RANK
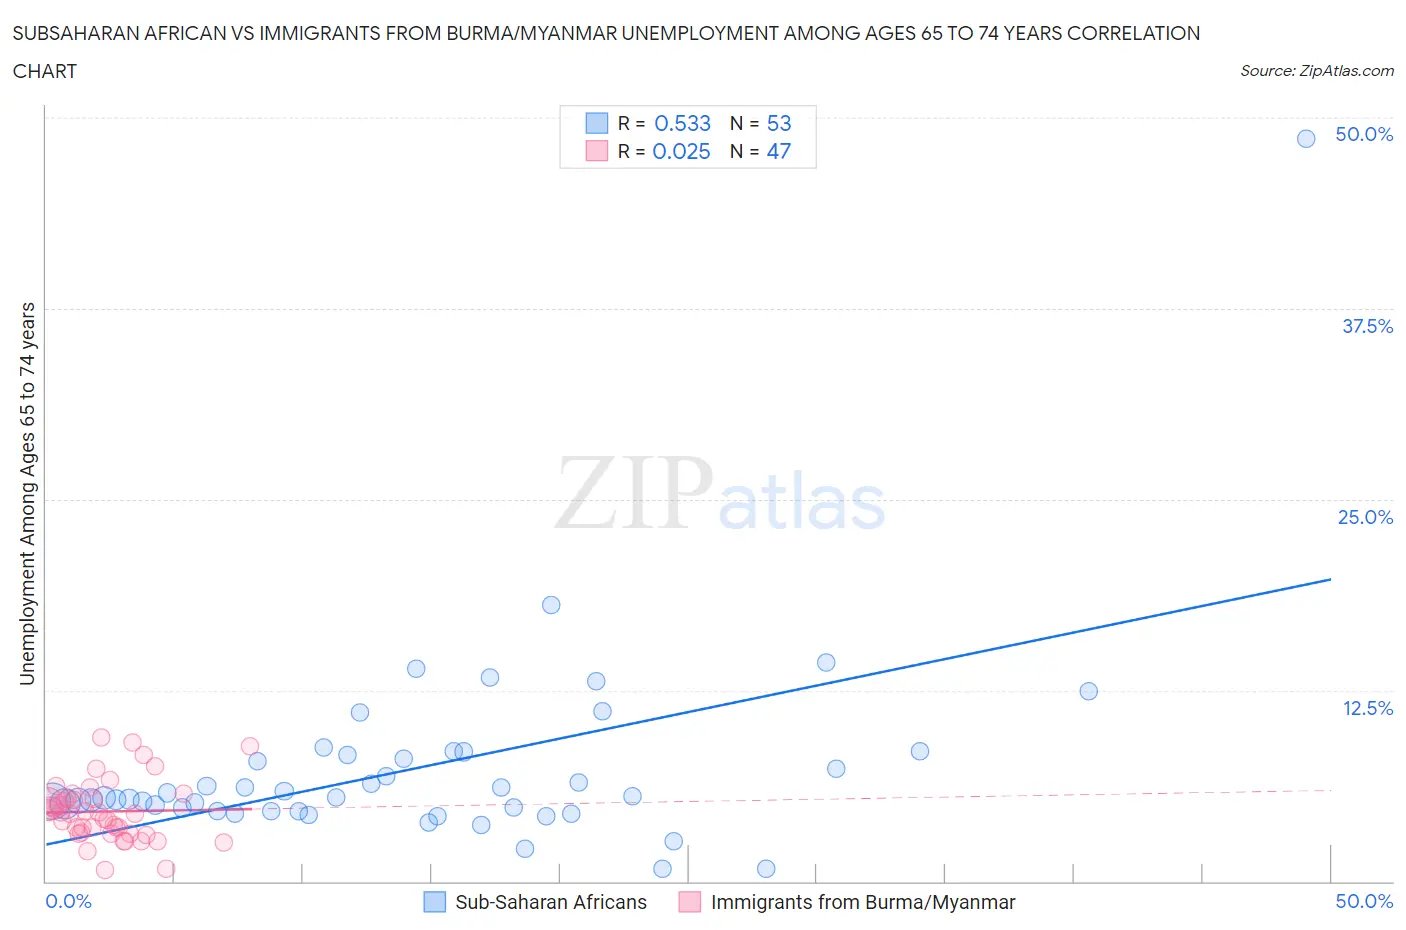
Subsaharan African vs Immigrants from Burma/Myanmar Unemployment Among Ages 65 to 74 years Correlation Chart
The statistical analysis conducted on geographies consisting of 423,071,215 people shows a substantial positive correlation between the proportion of Sub-Saharan Africans and unemployment rate among population between the ages 65 and 74 in the United States with a correlation coefficient (R) of 0.533 and weighted average of 5.4%. Similarly, the statistical analysis conducted on geographies consisting of 162,372,349 people shows no correlation between the proportion of Immigrants from Burma/Myanmar and unemployment rate among population between the ages 65 and 74 in the United States with a correlation coefficient (R) of 0.025 and weighted average of 4.8%, a difference of 13.0%.
Unemployment Among Ages 65 to 74 years Correlation Summary
| Measurement | Subsaharan African | Immigrants from Burma/Myanmar |
| Minimum | 0.80% | 0.75% |
| Maximum | 48.6% | 9.4% |
| Range | 47.8% | 8.6% |
| Mean | 7.4% | 4.6% |
| Median | 5.5% | 4.5% |
| Interquartile 25% (IQ1) | 4.6% | 3.1% |
| Interquartile 75% (IQ3) | 8.4% | 5.4% |
| Interquartile Range (IQR) | 3.8% | 2.3% |
| Standard Deviation (Sample) | 6.7% | 2.0% |
| Standard Deviation (Population) | 6.6% | 2.0% |
Similar Demographics by Unemployment Among Ages 65 to 74 years
Demographics Similar to Sub-Saharan Africans by Unemployment Among Ages 65 to 74 years
In terms of unemployment among ages 65 to 74 years, the demographic groups most similar to Sub-Saharan Africans are Argentinean (5.4%, a difference of 0.0%), Seminole (5.4%, a difference of 0.0%), Icelander (5.4%, a difference of 0.010%), Immigrants from Western Asia (5.4%, a difference of 0.030%), and Immigrants from Pakistan (5.4%, a difference of 0.060%).
| Demographics | Rating | Rank | Unemployment Among Ages 65 to 74 years |
| Immigrants | China | 24.2 /100 | #195 | Fair 5.4% |
| Costa Ricans | 21.1 /100 | #196 | Fair 5.4% |
| Colville | 20.4 /100 | #197 | Fair 5.4% |
| Albanians | 17.8 /100 | #198 | Poor 5.4% |
| Immigrants | Belgium | 16.2 /100 | #199 | Poor 5.4% |
| Immigrants | Pakistan | 15.2 /100 | #200 | Poor 5.4% |
| Immigrants | Western Asia | 14.9 /100 | #201 | Poor 5.4% |
| Sub-Saharan Africans | 14.4 /100 | #202 | Poor 5.4% |
| Argentineans | 14.3 /100 | #203 | Poor 5.4% |
| Seminole | 14.3 /100 | #204 | Poor 5.4% |
| Icelanders | 14.2 /100 | #205 | Poor 5.4% |
| Africans | 12.8 /100 | #206 | Poor 5.5% |
| Immigrants | Uzbekistan | 12.5 /100 | #207 | Poor 5.5% |
| Dutch West Indians | 11.5 /100 | #208 | Poor 5.5% |
| Immigrants | Honduras | 10.4 /100 | #209 | Poor 5.5% |
Demographics Similar to Immigrants from Burma/Myanmar by Unemployment Among Ages 65 to 74 years
In terms of unemployment among ages 65 to 74 years, the demographic groups most similar to Immigrants from Burma/Myanmar are Kenyan (4.8%, a difference of 0.020%), Creek (4.8%, a difference of 0.090%), Menominee (4.8%, a difference of 0.14%), Immigrants from North Macedonia (4.8%, a difference of 0.29%), and Immigrants from Zaire (4.8%, a difference of 0.40%).
| Demographics | Rating | Rank | Unemployment Among Ages 65 to 74 years |
| Chickasaw | 100.0 /100 | #9 | Exceptional 4.7% |
| Osage | 100.0 /100 | #10 | Exceptional 4.7% |
| Immigrants | Congo | 100.0 /100 | #11 | Exceptional 4.7% |
| Tongans | 100.0 /100 | #12 | Exceptional 4.7% |
| Lumbee | 100.0 /100 | #13 | Exceptional 4.8% |
| Cubans | 100.0 /100 | #14 | Exceptional 4.8% |
| Immigrants | North Macedonia | 100.0 /100 | #15 | Exceptional 4.8% |
| Immigrants | Burma/Myanmar | 100.0 /100 | #16 | Exceptional 4.8% |
| Kenyans | 100.0 /100 | #17 | Exceptional 4.8% |
| Creek | 100.0 /100 | #18 | Exceptional 4.8% |
| Menominee | 100.0 /100 | #19 | Exceptional 4.8% |
| Immigrants | Zaire | 100.0 /100 | #20 | Exceptional 4.8% |
| Immigrants | Eritrea | 100.0 /100 | #21 | Exceptional 4.9% |
| Lebanese | 100.0 /100 | #22 | Exceptional 4.9% |
| Immigrants | Nepal | 100.0 /100 | #23 | Exceptional 4.9% |