Palestinian vs Immigrants from Burma/Myanmar Unemployment Among Ages 65 to 74 years
COMPARE
Palestinian
Immigrants from Burma/Myanmar
Unemployment Among Ages 65 to 74 years
Unemployment Among Ages 65 to 74 years Comparison
Palestinians
Immigrants from Burma/Myanmar
5.0%
UNEMPLOYMENT AMONG AGES 65 TO 74 YEARS
100.0/ 100
METRIC RATING
32nd/ 347
METRIC RANK
4.8%
UNEMPLOYMENT AMONG AGES 65 TO 74 YEARS
100.0/ 100
METRIC RATING
16th/ 347
METRIC RANK
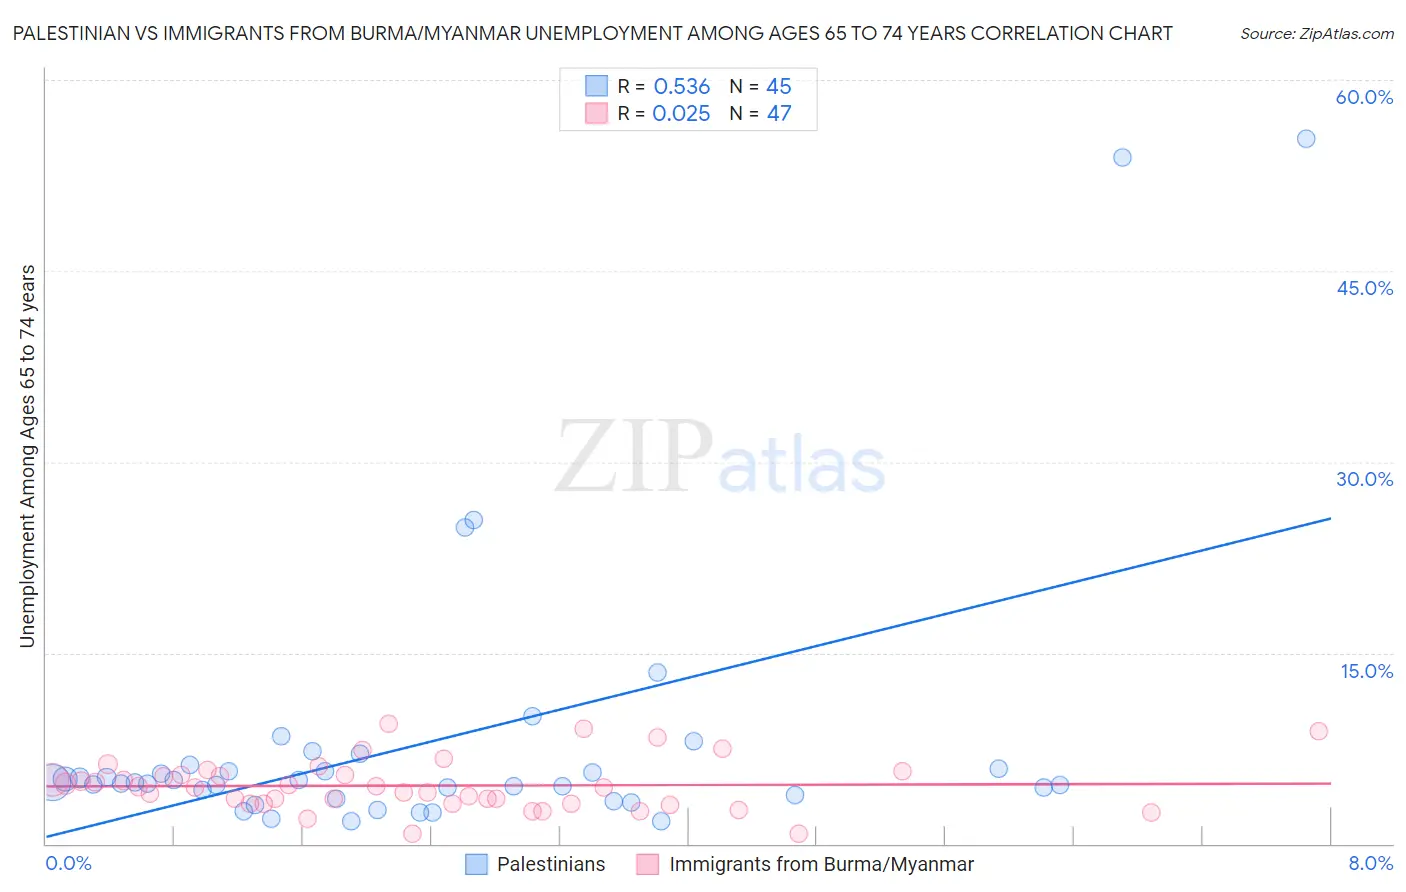
Palestinian vs Immigrants from Burma/Myanmar Unemployment Among Ages 65 to 74 years Correlation Chart
The statistical analysis conducted on geographies consisting of 204,086,595 people shows a substantial positive correlation between the proportion of Palestinians and unemployment rate among population between the ages 65 and 74 in the United States with a correlation coefficient (R) of 0.536 and weighted average of 5.0%. Similarly, the statistical analysis conducted on geographies consisting of 162,372,349 people shows no correlation between the proportion of Immigrants from Burma/Myanmar and unemployment rate among population between the ages 65 and 74 in the United States with a correlation coefficient (R) of 0.025 and weighted average of 4.8%, a difference of 4.0%.
Unemployment Among Ages 65 to 74 years Correlation Summary
| Measurement | Palestinian | Immigrants from Burma/Myanmar |
| Minimum | 1.8% | 0.75% |
| Maximum | 55.4% | 9.4% |
| Range | 53.6% | 8.6% |
| Mean | 8.0% | 4.6% |
| Median | 4.8% | 4.5% |
| Interquartile 25% (IQ1) | 3.7% | 3.1% |
| Interquartile 75% (IQ3) | 6.1% | 5.4% |
| Interquartile Range (IQR) | 2.4% | 2.3% |
| Standard Deviation (Sample) | 11.2% | 2.0% |
| Standard Deviation (Population) | 11.1% | 2.0% |
Demographics Similar to Palestinians and Immigrants from Burma/Myanmar by Unemployment Among Ages 65 to 74 years
In terms of unemployment among ages 65 to 74 years, the demographic groups most similar to Palestinians are Belgian (5.0%, a difference of 0.050%), Cambodian (5.0%, a difference of 0.060%), Slovene (5.0%, a difference of 0.28%), Immigrants from Lebanon (5.0%, a difference of 0.38%), and Ethiopian (5.0%, a difference of 0.47%). Similarly, the demographic groups most similar to Immigrants from Burma/Myanmar are Kenyan (4.8%, a difference of 0.020%), Creek (4.8%, a difference of 0.090%), Menominee (4.8%, a difference of 0.14%), Immigrants from North Macedonia (4.8%, a difference of 0.29%), and Immigrants from Zaire (4.8%, a difference of 0.40%).
| Demographics | Rating | Rank | Unemployment Among Ages 65 to 74 years |
| Cubans | 100.0 /100 | #14 | Exceptional 4.8% |
| Immigrants | North Macedonia | 100.0 /100 | #15 | Exceptional 4.8% |
| Immigrants | Burma/Myanmar | 100.0 /100 | #16 | Exceptional 4.8% |
| Kenyans | 100.0 /100 | #17 | Exceptional 4.8% |
| Creek | 100.0 /100 | #18 | Exceptional 4.8% |
| Menominee | 100.0 /100 | #19 | Exceptional 4.8% |
| Immigrants | Zaire | 100.0 /100 | #20 | Exceptional 4.8% |
| Immigrants | Eritrea | 100.0 /100 | #21 | Exceptional 4.9% |
| Lebanese | 100.0 /100 | #22 | Exceptional 4.9% |
| Immigrants | Nepal | 100.0 /100 | #23 | Exceptional 4.9% |
| Iraqis | 100.0 /100 | #24 | Exceptional 4.9% |
| Macedonians | 100.0 /100 | #25 | Exceptional 5.0% |
| Czechs | 100.0 /100 | #26 | Exceptional 5.0% |
| Norwegians | 100.0 /100 | #27 | Exceptional 5.0% |
| Bulgarians | 100.0 /100 | #28 | Exceptional 5.0% |
| Ethiopians | 100.0 /100 | #29 | Exceptional 5.0% |
| Immigrants | Lebanon | 100.0 /100 | #30 | Exceptional 5.0% |
| Slovenes | 100.0 /100 | #31 | Exceptional 5.0% |
| Palestinians | 100.0 /100 | #32 | Exceptional 5.0% |
| Belgians | 100.0 /100 | #33 | Exceptional 5.0% |
| Cambodians | 100.0 /100 | #34 | Exceptional 5.0% |