Assyrian/Chaldean/Syriac vs Immigrants from Burma/Myanmar Unemployment Among Ages 65 to 74 years
COMPARE
Assyrian/Chaldean/Syriac
Immigrants from Burma/Myanmar
Unemployment Among Ages 65 to 74 years
Unemployment Among Ages 65 to 74 years Comparison
Assyrians/Chaldeans/Syriacs
Immigrants from Burma/Myanmar
5.1%
UNEMPLOYMENT AMONG AGES 65 TO 74 YEARS
99.9/ 100
METRIC RATING
43rd/ 347
METRIC RANK
4.8%
UNEMPLOYMENT AMONG AGES 65 TO 74 YEARS
100.0/ 100
METRIC RATING
16th/ 347
METRIC RANK
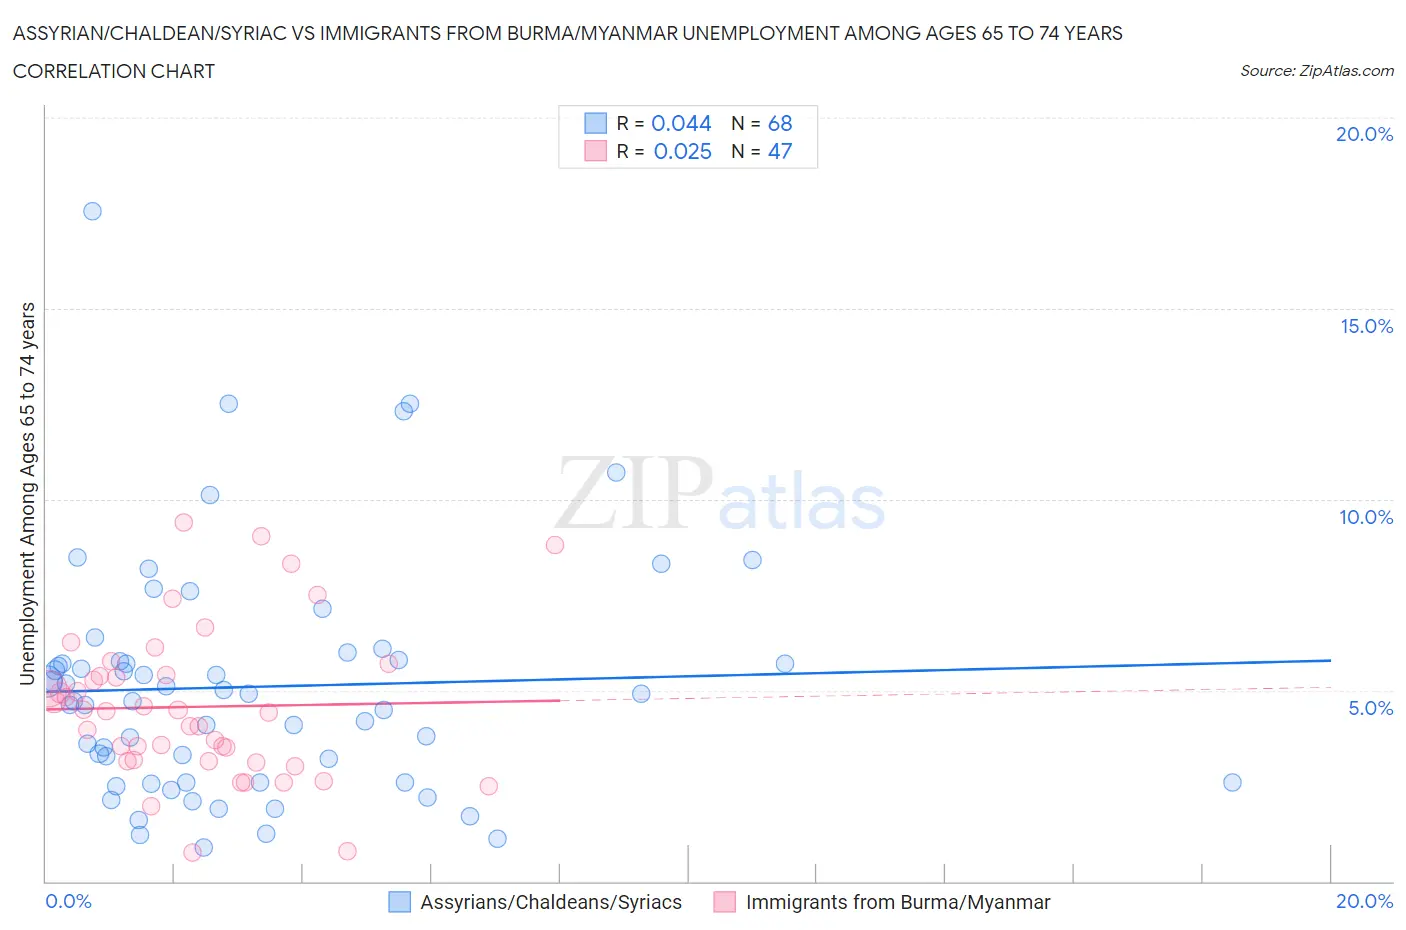
Assyrian/Chaldean/Syriac vs Immigrants from Burma/Myanmar Unemployment Among Ages 65 to 74 years Correlation Chart
The statistical analysis conducted on geographies consisting of 106,069,600 people shows no correlation between the proportion of Assyrians/Chaldeans/Syriacs and unemployment rate among population between the ages 65 and 74 in the United States with a correlation coefficient (R) of 0.044 and weighted average of 5.1%. Similarly, the statistical analysis conducted on geographies consisting of 162,372,349 people shows no correlation between the proportion of Immigrants from Burma/Myanmar and unemployment rate among population between the ages 65 and 74 in the United States with a correlation coefficient (R) of 0.025 and weighted average of 4.8%, a difference of 5.1%.
Unemployment Among Ages 65 to 74 years Correlation Summary
| Measurement | Assyrian/Chaldean/Syriac | Immigrants from Burma/Myanmar |
| Minimum | 0.90% | 0.75% |
| Maximum | 17.5% | 9.4% |
| Range | 16.6% | 8.6% |
| Mean | 5.1% | 4.6% |
| Median | 4.8% | 4.5% |
| Interquartile 25% (IQ1) | 2.6% | 3.1% |
| Interquartile 75% (IQ3) | 5.8% | 5.4% |
| Interquartile Range (IQR) | 3.2% | 2.3% |
| Standard Deviation (Sample) | 3.1% | 2.0% |
| Standard Deviation (Population) | 3.1% | 2.0% |
Similar Demographics by Unemployment Among Ages 65 to 74 years
Demographics Similar to Assyrians/Chaldeans/Syriacs by Unemployment Among Ages 65 to 74 years
In terms of unemployment among ages 65 to 74 years, the demographic groups most similar to Assyrians/Chaldeans/Syriacs are Immigrants from India (5.1%, a difference of 0.090%), Jordanian (5.1%, a difference of 0.12%), Sioux (5.1%, a difference of 0.20%), Ugandan (5.1%, a difference of 0.27%), and Immigrants from Iraq (5.1%, a difference of 0.28%).
| Demographics | Rating | Rank | Unemployment Among Ages 65 to 74 years |
| Immigrants | Kuwait | 99.9 /100 | #36 | Exceptional 5.0% |
| Immigrants | Eastern Africa | 99.9 /100 | #37 | Exceptional 5.0% |
| Nepalese | 99.9 /100 | #38 | Exceptional 5.0% |
| Immigrants | Sweden | 99.9 /100 | #39 | Exceptional 5.0% |
| Immigrants | Iraq | 99.9 /100 | #40 | Exceptional 5.1% |
| Ugandans | 99.9 /100 | #41 | Exceptional 5.1% |
| Jordanians | 99.9 /100 | #42 | Exceptional 5.1% |
| Assyrians/Chaldeans/Syriacs | 99.9 /100 | #43 | Exceptional 5.1% |
| Immigrants | India | 99.9 /100 | #44 | Exceptional 5.1% |
| Sioux | 99.8 /100 | #45 | Exceptional 5.1% |
| Immigrants | Kenya | 99.8 /100 | #46 | Exceptional 5.1% |
| Immigrants | Uganda | 99.8 /100 | #47 | Exceptional 5.1% |
| Choctaw | 99.8 /100 | #48 | Exceptional 5.1% |
| Immigrants | Austria | 99.8 /100 | #49 | Exceptional 5.1% |
| Immigrants | Zimbabwe | 99.7 /100 | #50 | Exceptional 5.1% |
Demographics Similar to Immigrants from Burma/Myanmar by Unemployment Among Ages 65 to 74 years
In terms of unemployment among ages 65 to 74 years, the demographic groups most similar to Immigrants from Burma/Myanmar are Kenyan (4.8%, a difference of 0.020%), Creek (4.8%, a difference of 0.090%), Menominee (4.8%, a difference of 0.14%), Immigrants from North Macedonia (4.8%, a difference of 0.29%), and Immigrants from Zaire (4.8%, a difference of 0.40%).
| Demographics | Rating | Rank | Unemployment Among Ages 65 to 74 years |
| Chickasaw | 100.0 /100 | #9 | Exceptional 4.7% |
| Osage | 100.0 /100 | #10 | Exceptional 4.7% |
| Immigrants | Congo | 100.0 /100 | #11 | Exceptional 4.7% |
| Tongans | 100.0 /100 | #12 | Exceptional 4.7% |
| Lumbee | 100.0 /100 | #13 | Exceptional 4.8% |
| Cubans | 100.0 /100 | #14 | Exceptional 4.8% |
| Immigrants | North Macedonia | 100.0 /100 | #15 | Exceptional 4.8% |
| Immigrants | Burma/Myanmar | 100.0 /100 | #16 | Exceptional 4.8% |
| Kenyans | 100.0 /100 | #17 | Exceptional 4.8% |
| Creek | 100.0 /100 | #18 | Exceptional 4.8% |
| Menominee | 100.0 /100 | #19 | Exceptional 4.8% |
| Immigrants | Zaire | 100.0 /100 | #20 | Exceptional 4.8% |
| Immigrants | Eritrea | 100.0 /100 | #21 | Exceptional 4.9% |
| Lebanese | 100.0 /100 | #22 | Exceptional 4.9% |
| Immigrants | Nepal | 100.0 /100 | #23 | Exceptional 4.9% |