Subsaharan African vs Immigrants from Burma/Myanmar Unemployment Among Ages 25 to 29 years
COMPARE
Subsaharan African
Immigrants from Burma/Myanmar
Unemployment Among Ages 25 to 29 years
Unemployment Among Ages 25 to 29 years Comparison
Sub-Saharan Africans
Immigrants from Burma/Myanmar
7.2%
UNEMPLOYMENT AMONG AGES 25 TO 29 YEARS
0.6/ 100
METRIC RATING
248th/ 347
METRIC RANK
6.2%
UNEMPLOYMENT AMONG AGES 25 TO 29 YEARS
98.7/ 100
METRIC RATING
56th/ 347
METRIC RANK
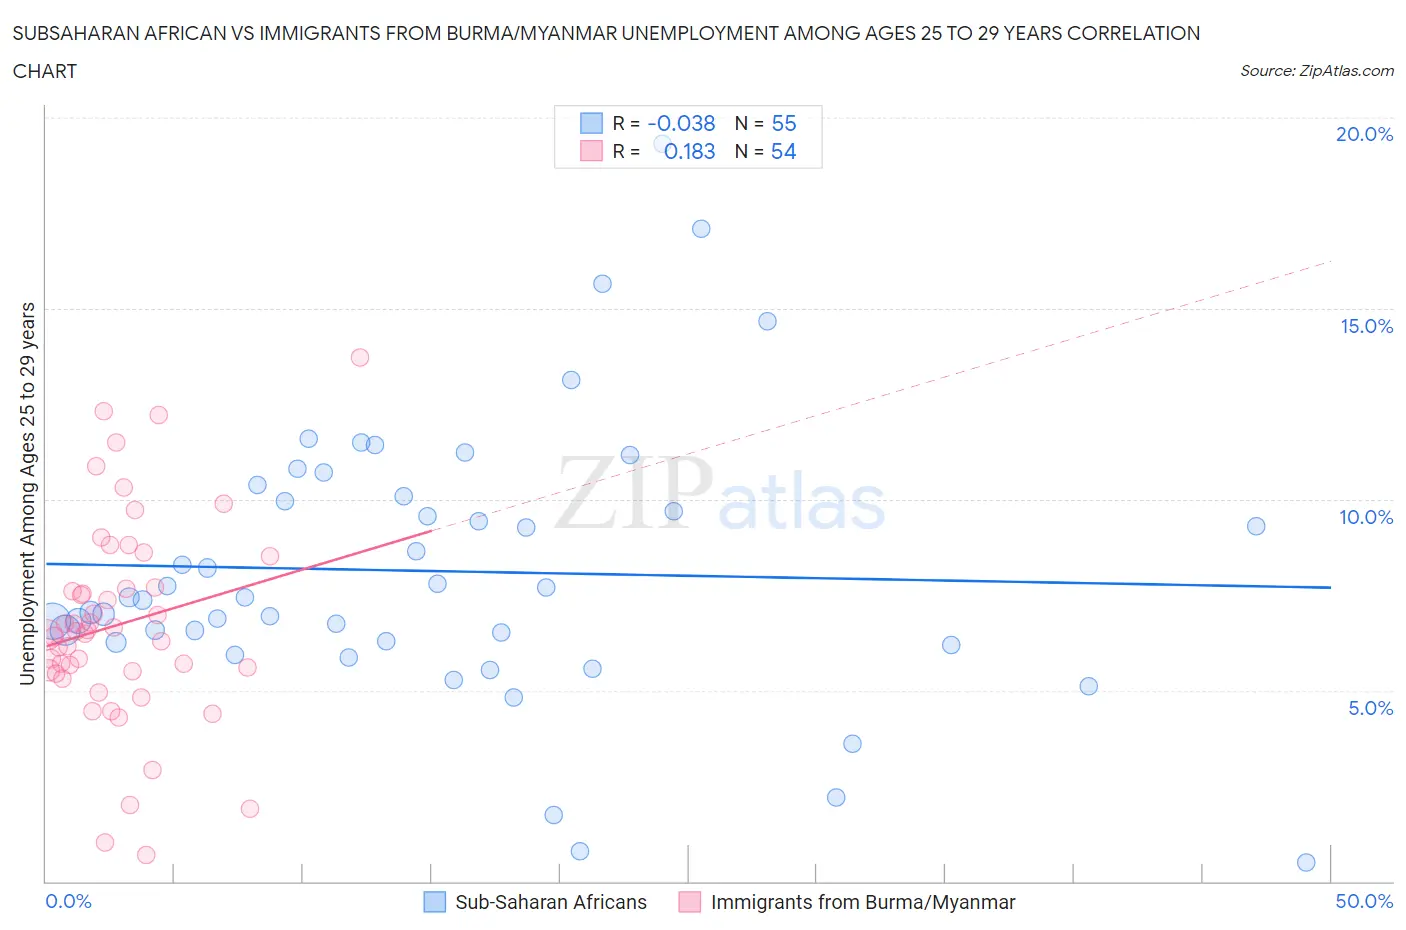
Subsaharan African vs Immigrants from Burma/Myanmar Unemployment Among Ages 25 to 29 years Correlation Chart
The statistical analysis conducted on geographies consisting of 472,657,928 people shows no correlation between the proportion of Sub-Saharan Africans and unemployment rate among population between the ages 25 and 29 in the United States with a correlation coefficient (R) of -0.038 and weighted average of 7.2%. Similarly, the statistical analysis conducted on geographies consisting of 169,671,818 people shows a poor positive correlation between the proportion of Immigrants from Burma/Myanmar and unemployment rate among population between the ages 25 and 29 in the United States with a correlation coefficient (R) of 0.183 and weighted average of 6.2%, a difference of 15.5%.
Unemployment Among Ages 25 to 29 years Correlation Summary
| Measurement | Subsaharan African | Immigrants from Burma/Myanmar |
| Minimum | 0.50% | 0.70% |
| Maximum | 19.3% | 13.7% |
| Range | 18.8% | 13.0% |
| Mean | 8.1% | 6.7% |
| Median | 7.4% | 6.5% |
| Interquartile 25% (IQ1) | 6.3% | 5.5% |
| Interquartile 75% (IQ3) | 10.1% | 7.7% |
| Interquartile Range (IQR) | 3.8% | 2.2% |
| Standard Deviation (Sample) | 3.6% | 2.7% |
| Standard Deviation (Population) | 3.6% | 2.6% |
Similar Demographics by Unemployment Among Ages 25 to 29 years
Demographics Similar to Sub-Saharan Africans by Unemployment Among Ages 25 to 29 years
In terms of unemployment among ages 25 to 29 years, the demographic groups most similar to Sub-Saharan Africans are Seminole (7.2%, a difference of 0.020%), Immigrants from Guatemala (7.2%, a difference of 0.17%), Immigrants from Uzbekistan (7.2%, a difference of 0.18%), Delaware (7.2%, a difference of 0.19%), and Portuguese (7.2%, a difference of 0.25%).
| Demographics | Rating | Rank | Unemployment Among Ages 25 to 29 years |
| Immigrants | Sierra Leone | 1.3 /100 | #241 | Tragic 7.1% |
| Spanish American Indians | 1.1 /100 | #242 | Tragic 7.1% |
| Yaqui | 1.0 /100 | #243 | Tragic 7.1% |
| Immigrants | Nonimmigrants | 0.9 /100 | #244 | Tragic 7.1% |
| Guatemalans | 0.9 /100 | #245 | Tragic 7.1% |
| Immigrants | Uzbekistan | 0.7 /100 | #246 | Tragic 7.2% |
| Immigrants | Guatemala | 0.7 /100 | #247 | Tragic 7.2% |
| Sub-Saharan Africans | 0.6 /100 | #248 | Tragic 7.2% |
| Seminole | 0.6 /100 | #249 | Tragic 7.2% |
| Delaware | 0.5 /100 | #250 | Tragic 7.2% |
| Portuguese | 0.5 /100 | #251 | Tragic 7.2% |
| Sierra Leoneans | 0.4 /100 | #252 | Tragic 7.2% |
| Immigrants | Portugal | 0.3 /100 | #253 | Tragic 7.2% |
| Ghanaians | 0.3 /100 | #254 | Tragic 7.2% |
| Immigrants | Cameroon | 0.3 /100 | #255 | Tragic 7.2% |
Demographics Similar to Immigrants from Burma/Myanmar by Unemployment Among Ages 25 to 29 years
In terms of unemployment among ages 25 to 29 years, the demographic groups most similar to Immigrants from Burma/Myanmar are Immigrants from Netherlands (6.2%, a difference of 0.020%), Immigrants from Saudi Arabia (6.2%, a difference of 0.090%), Swedish (6.2%, a difference of 0.20%), Turkish (6.2%, a difference of 0.22%), and Immigrants from Eastern Asia (6.2%, a difference of 0.25%).
| Demographics | Rating | Rank | Unemployment Among Ages 25 to 29 years |
| German Russians | 99.0 /100 | #49 | Exceptional 6.2% |
| Soviet Union | 98.9 /100 | #50 | Exceptional 6.2% |
| Burmese | 98.9 /100 | #51 | Exceptional 6.2% |
| Immigrants | Turkey | 98.9 /100 | #52 | Exceptional 6.2% |
| Turks | 98.8 /100 | #53 | Exceptional 6.2% |
| Swedes | 98.8 /100 | #54 | Exceptional 6.2% |
| Immigrants | Netherlands | 98.7 /100 | #55 | Exceptional 6.2% |
| Immigrants | Burma/Myanmar | 98.7 /100 | #56 | Exceptional 6.2% |
| Immigrants | Saudi Arabia | 98.6 /100 | #57 | Exceptional 6.2% |
| Immigrants | Eastern Asia | 98.4 /100 | #58 | Exceptional 6.2% |
| Luxembourgers | 98.3 /100 | #59 | Exceptional 6.2% |
| Immigrants | Taiwan | 98.3 /100 | #60 | Exceptional 6.2% |
| Bhutanese | 98.2 /100 | #61 | Exceptional 6.2% |
| Immigrants | China | 98.1 /100 | #62 | Exceptional 6.2% |
| Kenyans | 98.0 /100 | #63 | Exceptional 6.3% |