Subsaharan African vs Turkish Unemployment Among Ages 65 to 74 years
COMPARE
Subsaharan African
Turkish
Unemployment Among Ages 65 to 74 years
Unemployment Among Ages 65 to 74 years Comparison
Sub-Saharan Africans
Turks
5.4%
UNEMPLOYMENT AMONG AGES 65 TO 74 YEARS
14.4/ 100
METRIC RATING
202nd/ 347
METRIC RANK
5.3%
UNEMPLOYMENT AMONG AGES 65 TO 74 YEARS
76.2/ 100
METRIC RATING
142nd/ 347
METRIC RANK
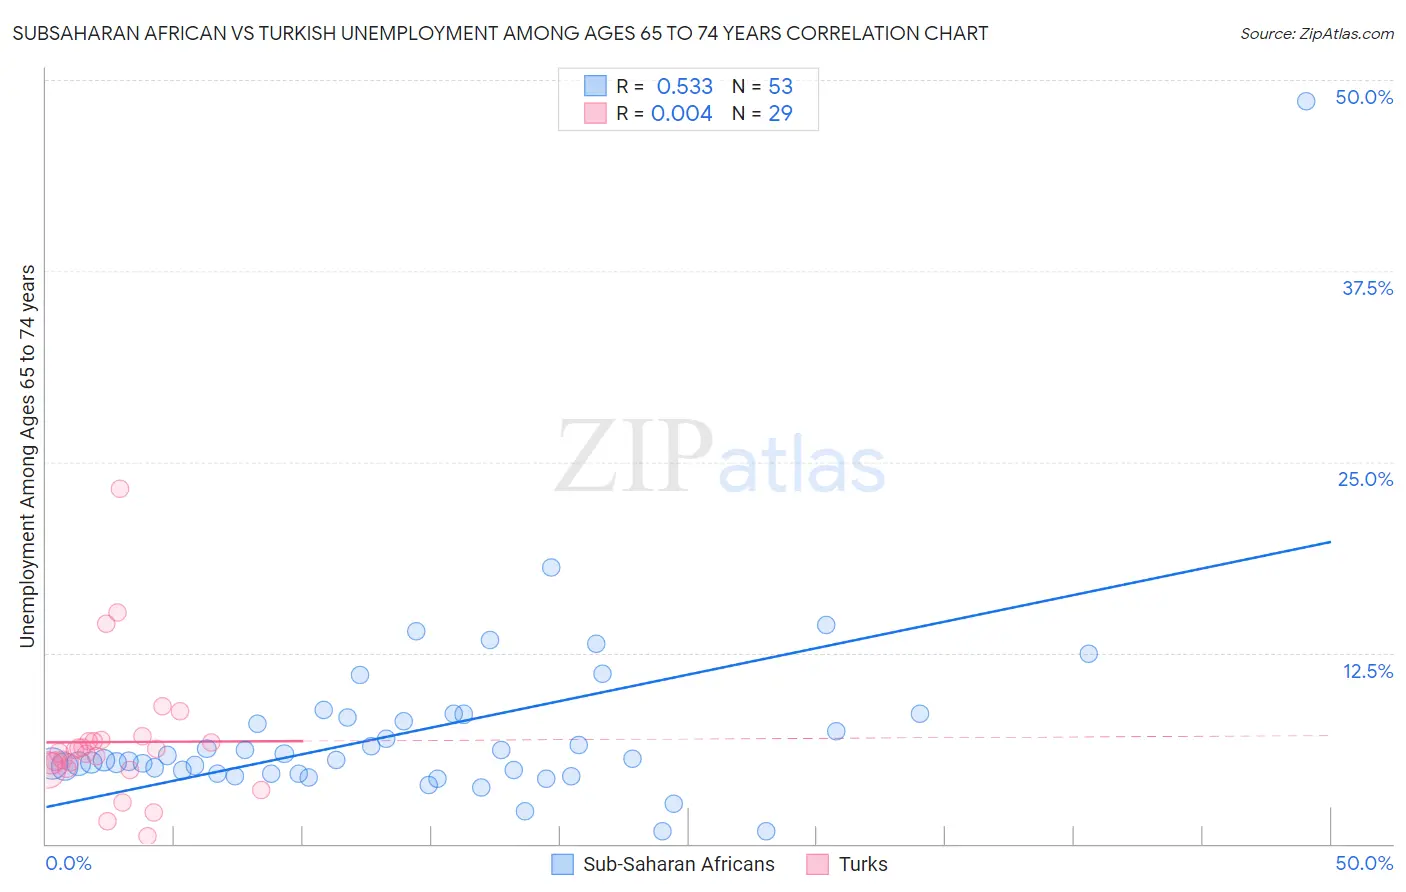
Subsaharan African vs Turkish Unemployment Among Ages 65 to 74 years Correlation Chart
The statistical analysis conducted on geographies consisting of 423,071,215 people shows a substantial positive correlation between the proportion of Sub-Saharan Africans and unemployment rate among population between the ages 65 and 74 in the United States with a correlation coefficient (R) of 0.533 and weighted average of 5.4%. Similarly, the statistical analysis conducted on geographies consisting of 249,999,794 people shows no correlation between the proportion of Turks and unemployment rate among population between the ages 65 and 74 in the United States with a correlation coefficient (R) of 0.004 and weighted average of 5.3%, a difference of 2.5%.
Unemployment Among Ages 65 to 74 years Correlation Summary
| Measurement | Subsaharan African | Turkish |
| Minimum | 0.80% | 0.50% |
| Maximum | 48.6% | 23.2% |
| Range | 47.8% | 22.7% |
| Mean | 7.4% | 6.7% |
| Median | 5.5% | 5.9% |
| Interquartile 25% (IQ1) | 4.6% | 4.9% |
| Interquartile 75% (IQ3) | 8.4% | 6.8% |
| Interquartile Range (IQR) | 3.8% | 1.9% |
| Standard Deviation (Sample) | 6.7% | 4.4% |
| Standard Deviation (Population) | 6.6% | 4.3% |
Similar Demographics by Unemployment Among Ages 65 to 74 years
Demographics Similar to Sub-Saharan Africans by Unemployment Among Ages 65 to 74 years
In terms of unemployment among ages 65 to 74 years, the demographic groups most similar to Sub-Saharan Africans are Argentinean (5.4%, a difference of 0.0%), Seminole (5.4%, a difference of 0.0%), Icelander (5.4%, a difference of 0.010%), Immigrants from Western Asia (5.4%, a difference of 0.030%), and Immigrants from Pakistan (5.4%, a difference of 0.060%).
| Demographics | Rating | Rank | Unemployment Among Ages 65 to 74 years |
| Immigrants | China | 24.2 /100 | #195 | Fair 5.4% |
| Costa Ricans | 21.1 /100 | #196 | Fair 5.4% |
| Colville | 20.4 /100 | #197 | Fair 5.4% |
| Albanians | 17.8 /100 | #198 | Poor 5.4% |
| Immigrants | Belgium | 16.2 /100 | #199 | Poor 5.4% |
| Immigrants | Pakistan | 15.2 /100 | #200 | Poor 5.4% |
| Immigrants | Western Asia | 14.9 /100 | #201 | Poor 5.4% |
| Sub-Saharan Africans | 14.4 /100 | #202 | Poor 5.4% |
| Argentineans | 14.3 /100 | #203 | Poor 5.4% |
| Seminole | 14.3 /100 | #204 | Poor 5.4% |
| Icelanders | 14.2 /100 | #205 | Poor 5.4% |
| Africans | 12.8 /100 | #206 | Poor 5.5% |
| Immigrants | Uzbekistan | 12.5 /100 | #207 | Poor 5.5% |
| Dutch West Indians | 11.5 /100 | #208 | Poor 5.5% |
| Immigrants | Honduras | 10.4 /100 | #209 | Poor 5.5% |
Demographics Similar to Turks by Unemployment Among Ages 65 to 74 years
In terms of unemployment among ages 65 to 74 years, the demographic groups most similar to Turks are New Zealander (5.3%, a difference of 0.0%), Immigrants from Chile (5.3%, a difference of 0.010%), Canadian (5.3%, a difference of 0.050%), Irish (5.3%, a difference of 0.060%), and Immigrants from Latvia (5.3%, a difference of 0.070%).
| Demographics | Rating | Rank | Unemployment Among Ages 65 to 74 years |
| Immigrants | Serbia | 81.8 /100 | #135 | Excellent 5.3% |
| Celtics | 80.8 /100 | #136 | Excellent 5.3% |
| Immigrants | Afghanistan | 80.8 /100 | #137 | Excellent 5.3% |
| Chileans | 79.7 /100 | #138 | Good 5.3% |
| Finns | 79.0 /100 | #139 | Good 5.3% |
| Immigrants | Laos | 78.6 /100 | #140 | Good 5.3% |
| Immigrants | Asia | 78.4 /100 | #141 | Good 5.3% |
| Turks | 76.2 /100 | #142 | Good 5.3% |
| New Zealanders | 76.1 /100 | #143 | Good 5.3% |
| Immigrants | Chile | 76.0 /100 | #144 | Good 5.3% |
| Canadians | 75.0 /100 | #145 | Good 5.3% |
| Irish | 74.8 /100 | #146 | Good 5.3% |
| Immigrants | Latvia | 74.6 /100 | #147 | Good 5.3% |
| Immigrants | Sri Lanka | 73.8 /100 | #148 | Good 5.3% |
| Immigrants | Romania | 73.5 /100 | #149 | Good 5.3% |