Subsaharan African vs Spanish American Unemployment Among Ages 65 to 74 years
COMPARE
Subsaharan African
Spanish American
Unemployment Among Ages 65 to 74 years
Unemployment Among Ages 65 to 74 years Comparison
Sub-Saharan Africans
Spanish Americans
5.4%
UNEMPLOYMENT AMONG AGES 65 TO 74 YEARS
14.4/ 100
METRIC RATING
202nd/ 347
METRIC RANK
5.4%
UNEMPLOYMENT AMONG AGES 65 TO 74 YEARS
38.2/ 100
METRIC RATING
182nd/ 347
METRIC RANK
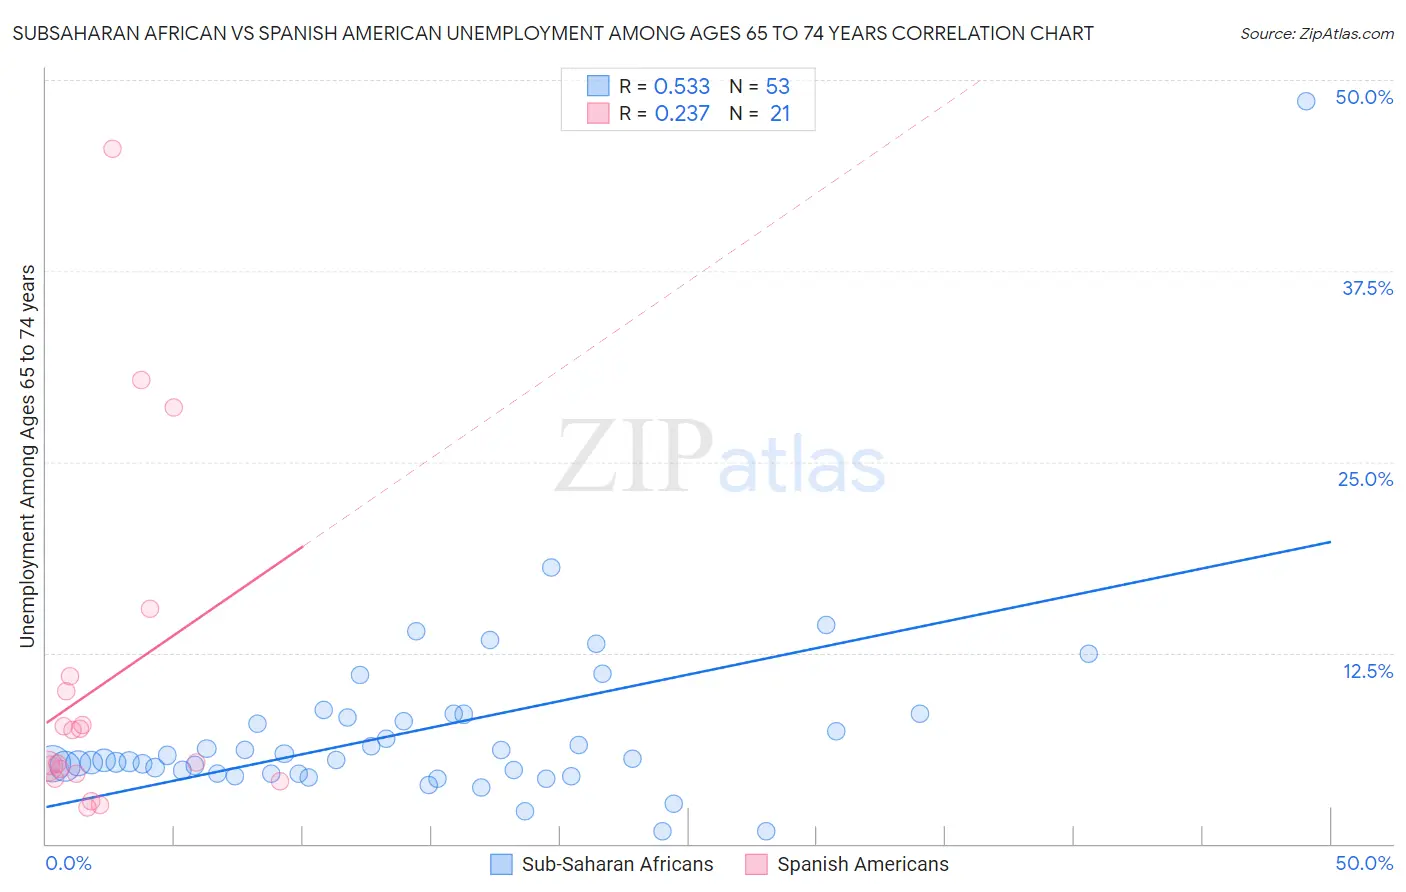
Subsaharan African vs Spanish American Unemployment Among Ages 65 to 74 years Correlation Chart
The statistical analysis conducted on geographies consisting of 423,071,215 people shows a substantial positive correlation between the proportion of Sub-Saharan Africans and unemployment rate among population between the ages 65 and 74 in the United States with a correlation coefficient (R) of 0.533 and weighted average of 5.4%. Similarly, the statistical analysis conducted on geographies consisting of 98,707,730 people shows a weak positive correlation between the proportion of Spanish Americans and unemployment rate among population between the ages 65 and 74 in the United States with a correlation coefficient (R) of 0.237 and weighted average of 5.4%, a difference of 1.1%.
Unemployment Among Ages 65 to 74 years Correlation Summary
| Measurement | Subsaharan African | Spanish American |
| Minimum | 0.80% | 2.4% |
| Maximum | 48.6% | 45.5% |
| Range | 47.8% | 43.1% |
| Mean | 7.4% | 10.4% |
| Median | 5.5% | 5.3% |
| Interquartile 25% (IQ1) | 4.6% | 4.4% |
| Interquartile 75% (IQ3) | 8.4% | 10.5% |
| Interquartile Range (IQR) | 3.8% | 6.1% |
| Standard Deviation (Sample) | 6.7% | 11.1% |
| Standard Deviation (Population) | 6.6% | 10.8% |
Demographics Similar to Sub-Saharan Africans and Spanish Americans by Unemployment Among Ages 65 to 74 years
In terms of unemployment among ages 65 to 74 years, the demographic groups most similar to Sub-Saharan Africans are Immigrants from Western Asia (5.4%, a difference of 0.030%), Immigrants from Pakistan (5.4%, a difference of 0.060%), Immigrants from Belgium (5.4%, a difference of 0.12%), Albanian (5.4%, a difference of 0.21%), and Colville (5.4%, a difference of 0.35%). Similarly, the demographic groups most similar to Spanish Americans are Immigrants from Spain (5.4%, a difference of 0.030%), Immigrants from Senegal (5.4%, a difference of 0.11%), Russian (5.4%, a difference of 0.14%), Lithuanian (5.4%, a difference of 0.21%), and Nonimmigrants (5.4%, a difference of 0.28%).
| Demographics | Rating | Rank | Unemployment Among Ages 65 to 74 years |
| Spanish Americans | 38.2 /100 | #182 | Fair 5.4% |
| Immigrants | Spain | 37.3 /100 | #183 | Fair 5.4% |
| Immigrants | Senegal | 35.2 /100 | #184 | Fair 5.4% |
| Russians | 34.4 /100 | #185 | Fair 5.4% |
| Lithuanians | 32.4 /100 | #186 | Fair 5.4% |
| Immigrants | Nonimmigrants | 30.6 /100 | #187 | Fair 5.4% |
| Immigrants | Europe | 28.8 /100 | #188 | Fair 5.4% |
| Immigrants | Africa | 28.3 /100 | #189 | Fair 5.4% |
| Basques | 26.6 /100 | #190 | Fair 5.4% |
| Immigrants | Egypt | 26.5 /100 | #191 | Fair 5.4% |
| Maltese | 26.4 /100 | #192 | Fair 5.4% |
| Cherokee | 25.8 /100 | #193 | Fair 5.4% |
| Immigrants | Denmark | 24.7 /100 | #194 | Fair 5.4% |
| Immigrants | China | 24.2 /100 | #195 | Fair 5.4% |
| Costa Ricans | 21.1 /100 | #196 | Fair 5.4% |
| Colville | 20.4 /100 | #197 | Fair 5.4% |
| Albanians | 17.8 /100 | #198 | Poor 5.4% |
| Immigrants | Belgium | 16.2 /100 | #199 | Poor 5.4% |
| Immigrants | Pakistan | 15.2 /100 | #200 | Poor 5.4% |
| Immigrants | Western Asia | 14.9 /100 | #201 | Poor 5.4% |
| Sub-Saharan Africans | 14.4 /100 | #202 | Poor 5.4% |