Immigrants from South Eastern Asia vs Immigrants from Burma/Myanmar Unemployment Among Ages 25 to 29 years
COMPARE
Immigrants from South Eastern Asia
Immigrants from Burma/Myanmar
Unemployment Among Ages 25 to 29 years
Unemployment Among Ages 25 to 29 years Comparison
Immigrants from South Eastern Asia
Immigrants from Burma/Myanmar
6.7%
UNEMPLOYMENT AMONG AGES 25 TO 29 YEARS
49.1/ 100
METRIC RATING
175th/ 347
METRIC RANK
6.2%
UNEMPLOYMENT AMONG AGES 25 TO 29 YEARS
98.7/ 100
METRIC RATING
56th/ 347
METRIC RANK
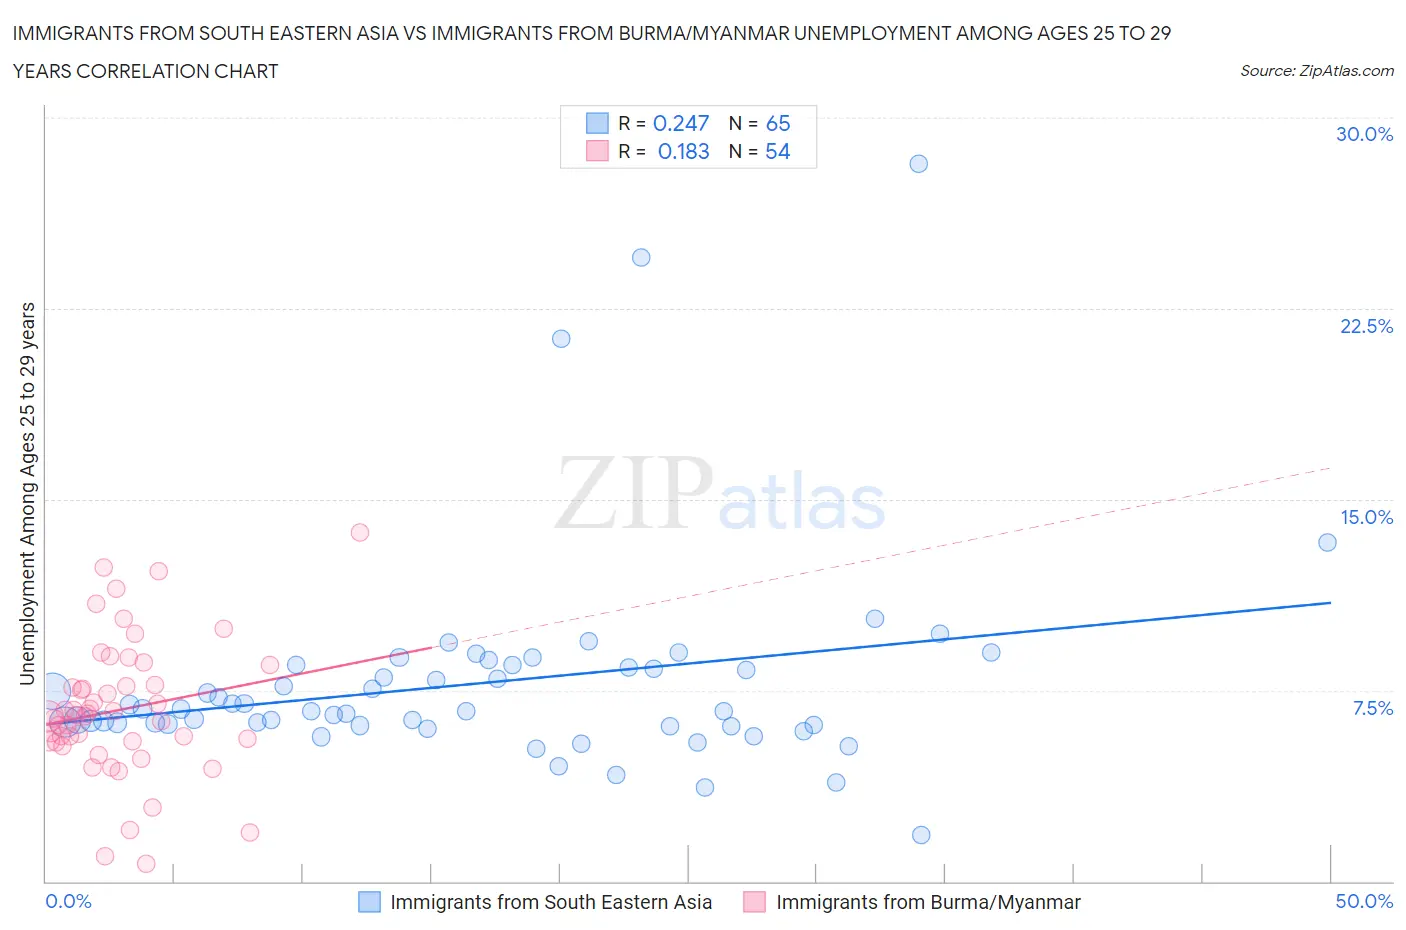
Immigrants from South Eastern Asia vs Immigrants from Burma/Myanmar Unemployment Among Ages 25 to 29 years Correlation Chart
The statistical analysis conducted on geographies consisting of 474,351,978 people shows a weak positive correlation between the proportion of Immigrants from South Eastern Asia and unemployment rate among population between the ages 25 and 29 in the United States with a correlation coefficient (R) of 0.247 and weighted average of 6.7%. Similarly, the statistical analysis conducted on geographies consisting of 169,671,818 people shows a poor positive correlation between the proportion of Immigrants from Burma/Myanmar and unemployment rate among population between the ages 25 and 29 in the United States with a correlation coefficient (R) of 0.183 and weighted average of 6.2%, a difference of 7.1%.
Unemployment Among Ages 25 to 29 years Correlation Summary
| Measurement | Immigrants from South Eastern Asia | Immigrants from Burma/Myanmar |
| Minimum | 1.8% | 0.70% |
| Maximum | 28.2% | 13.7% |
| Range | 26.4% | 13.0% |
| Mean | 7.8% | 6.7% |
| Median | 6.7% | 6.5% |
| Interquartile 25% (IQ1) | 6.1% | 5.5% |
| Interquartile 75% (IQ3) | 8.4% | 7.7% |
| Interquartile Range (IQR) | 2.3% | 2.2% |
| Standard Deviation (Sample) | 4.2% | 2.7% |
| Standard Deviation (Population) | 4.1% | 2.6% |
Similar Demographics by Unemployment Among Ages 25 to 29 years
Demographics Similar to Immigrants from South Eastern Asia by Unemployment Among Ages 25 to 29 years
In terms of unemployment among ages 25 to 29 years, the demographic groups most similar to Immigrants from South Eastern Asia are Immigrants from North America (6.6%, a difference of 0.060%), Osage (6.7%, a difference of 0.060%), Immigrants from Israel (6.7%, a difference of 0.080%), Russian (6.6%, a difference of 0.13%), and Bangladeshi (6.6%, a difference of 0.15%).
| Demographics | Rating | Rank | Unemployment Among Ages 25 to 29 years |
| Estonians | 54.8 /100 | #168 | Average 6.6% |
| South Americans | 54.5 /100 | #169 | Average 6.6% |
| Albanians | 53.5 /100 | #170 | Average 6.6% |
| Immigrants | Cambodia | 52.6 /100 | #171 | Average 6.6% |
| Bangladeshis | 51.6 /100 | #172 | Average 6.6% |
| Russians | 51.3 /100 | #173 | Average 6.6% |
| Immigrants | North America | 50.0 /100 | #174 | Average 6.6% |
| Immigrants | South Eastern Asia | 49.1 /100 | #175 | Average 6.7% |
| Osage | 48.1 /100 | #176 | Average 6.7% |
| Immigrants | Israel | 47.8 /100 | #177 | Average 6.7% |
| Immigrants | Iraq | 45.1 /100 | #178 | Average 6.7% |
| Costa Ricans | 44.9 /100 | #179 | Average 6.7% |
| Immigrants | Africa | 41.1 /100 | #180 | Average 6.7% |
| Immigrants | Western Europe | 41.1 /100 | #181 | Average 6.7% |
| Czechoslovakians | 40.7 /100 | #182 | Average 6.7% |
Demographics Similar to Immigrants from Burma/Myanmar by Unemployment Among Ages 25 to 29 years
In terms of unemployment among ages 25 to 29 years, the demographic groups most similar to Immigrants from Burma/Myanmar are Immigrants from Netherlands (6.2%, a difference of 0.020%), Immigrants from Saudi Arabia (6.2%, a difference of 0.090%), Swedish (6.2%, a difference of 0.20%), Turkish (6.2%, a difference of 0.22%), and Immigrants from Eastern Asia (6.2%, a difference of 0.25%).
| Demographics | Rating | Rank | Unemployment Among Ages 25 to 29 years |
| German Russians | 99.0 /100 | #49 | Exceptional 6.2% |
| Soviet Union | 98.9 /100 | #50 | Exceptional 6.2% |
| Burmese | 98.9 /100 | #51 | Exceptional 6.2% |
| Immigrants | Turkey | 98.9 /100 | #52 | Exceptional 6.2% |
| Turks | 98.8 /100 | #53 | Exceptional 6.2% |
| Swedes | 98.8 /100 | #54 | Exceptional 6.2% |
| Immigrants | Netherlands | 98.7 /100 | #55 | Exceptional 6.2% |
| Immigrants | Burma/Myanmar | 98.7 /100 | #56 | Exceptional 6.2% |
| Immigrants | Saudi Arabia | 98.6 /100 | #57 | Exceptional 6.2% |
| Immigrants | Eastern Asia | 98.4 /100 | #58 | Exceptional 6.2% |
| Luxembourgers | 98.3 /100 | #59 | Exceptional 6.2% |
| Immigrants | Taiwan | 98.3 /100 | #60 | Exceptional 6.2% |
| Bhutanese | 98.2 /100 | #61 | Exceptional 6.2% |
| Immigrants | China | 98.1 /100 | #62 | Exceptional 6.2% |
| Kenyans | 98.0 /100 | #63 | Exceptional 6.3% |