Subsaharan African vs Carpatho Rusyn Unemployment Among Ages 25 to 29 years
COMPARE
Subsaharan African
Carpatho Rusyn
Unemployment Among Ages 25 to 29 years
Unemployment Among Ages 25 to 29 years Comparison
Sub-Saharan Africans
Carpatho Rusyns
7.2%
UNEMPLOYMENT AMONG AGES 25 TO 29 YEARS
0.6/ 100
METRIC RATING
248th/ 347
METRIC RANK
6.3%
UNEMPLOYMENT AMONG AGES 25 TO 29 YEARS
96.9/ 100
METRIC RATING
74th/ 347
METRIC RANK
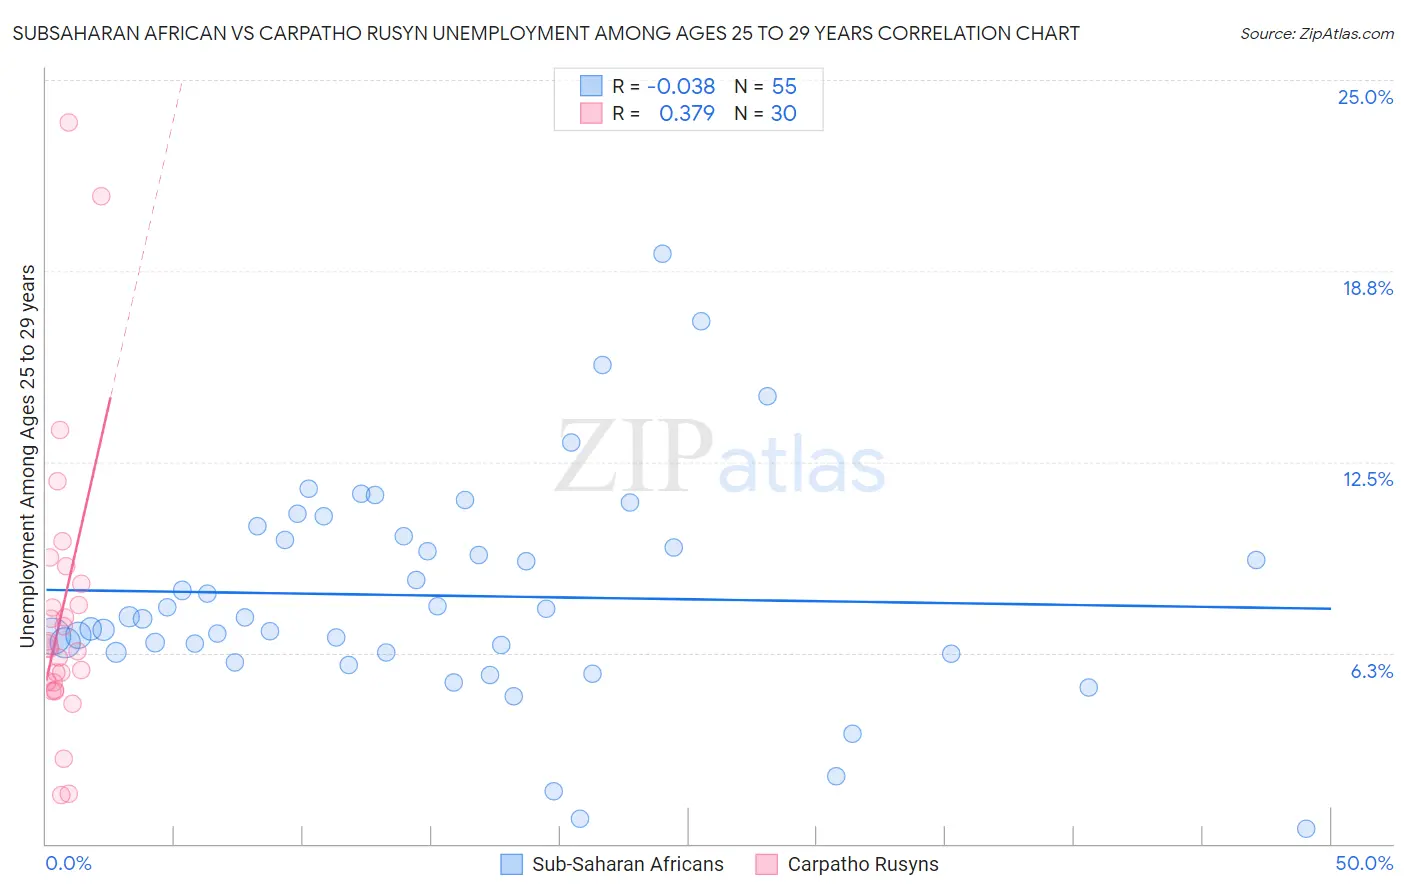
Subsaharan African vs Carpatho Rusyn Unemployment Among Ages 25 to 29 years Correlation Chart
The statistical analysis conducted on geographies consisting of 472,657,928 people shows no correlation between the proportion of Sub-Saharan Africans and unemployment rate among population between the ages 25 and 29 in the United States with a correlation coefficient (R) of -0.038 and weighted average of 7.2%. Similarly, the statistical analysis conducted on geographies consisting of 57,767,148 people shows a mild positive correlation between the proportion of Carpatho Rusyns and unemployment rate among population between the ages 25 and 29 in the United States with a correlation coefficient (R) of 0.379 and weighted average of 6.3%, a difference of 13.9%.
Unemployment Among Ages 25 to 29 years Correlation Summary
| Measurement | Subsaharan African | Carpatho Rusyn |
| Minimum | 0.50% | 1.6% |
| Maximum | 19.3% | 23.6% |
| Range | 18.8% | 22.0% |
| Mean | 8.1% | 7.7% |
| Median | 7.4% | 6.4% |
| Interquartile 25% (IQ1) | 6.3% | 5.3% |
| Interquartile 75% (IQ3) | 10.1% | 8.5% |
| Interquartile Range (IQR) | 3.8% | 3.2% |
| Standard Deviation (Sample) | 3.6% | 4.8% |
| Standard Deviation (Population) | 3.6% | 4.7% |
Similar Demographics by Unemployment Among Ages 25 to 29 years
Demographics Similar to Sub-Saharan Africans by Unemployment Among Ages 25 to 29 years
In terms of unemployment among ages 25 to 29 years, the demographic groups most similar to Sub-Saharan Africans are Seminole (7.2%, a difference of 0.020%), Immigrants from Guatemala (7.2%, a difference of 0.17%), Immigrants from Uzbekistan (7.2%, a difference of 0.18%), Delaware (7.2%, a difference of 0.19%), and Portuguese (7.2%, a difference of 0.25%).
| Demographics | Rating | Rank | Unemployment Among Ages 25 to 29 years |
| Immigrants | Sierra Leone | 1.3 /100 | #241 | Tragic 7.1% |
| Spanish American Indians | 1.1 /100 | #242 | Tragic 7.1% |
| Yaqui | 1.0 /100 | #243 | Tragic 7.1% |
| Immigrants | Nonimmigrants | 0.9 /100 | #244 | Tragic 7.1% |
| Guatemalans | 0.9 /100 | #245 | Tragic 7.1% |
| Immigrants | Uzbekistan | 0.7 /100 | #246 | Tragic 7.2% |
| Immigrants | Guatemala | 0.7 /100 | #247 | Tragic 7.2% |
| Sub-Saharan Africans | 0.6 /100 | #248 | Tragic 7.2% |
| Seminole | 0.6 /100 | #249 | Tragic 7.2% |
| Delaware | 0.5 /100 | #250 | Tragic 7.2% |
| Portuguese | 0.5 /100 | #251 | Tragic 7.2% |
| Sierra Leoneans | 0.4 /100 | #252 | Tragic 7.2% |
| Immigrants | Portugal | 0.3 /100 | #253 | Tragic 7.2% |
| Ghanaians | 0.3 /100 | #254 | Tragic 7.2% |
| Immigrants | Cameroon | 0.3 /100 | #255 | Tragic 7.2% |
Demographics Similar to Carpatho Rusyns by Unemployment Among Ages 25 to 29 years
In terms of unemployment among ages 25 to 29 years, the demographic groups most similar to Carpatho Rusyns are Belgian (6.3%, a difference of 0.020%), Immigrants from Jordan (6.3%, a difference of 0.070%), Immigrants from Korea (6.3%, a difference of 0.13%), Icelander (6.3%, a difference of 0.16%), and Asian (6.3%, a difference of 0.25%).
| Demographics | Rating | Rank | Unemployment Among Ages 25 to 29 years |
| Immigrants | Northern Africa | 97.8 /100 | #67 | Exceptional 6.3% |
| Palestinians | 97.7 /100 | #68 | Exceptional 6.3% |
| Immigrants | Hong Kong | 97.5 /100 | #69 | Exceptional 6.3% |
| Immigrants | Malaysia | 97.5 /100 | #70 | Exceptional 6.3% |
| Immigrants | France | 97.4 /100 | #71 | Exceptional 6.3% |
| Scandinavians | 97.4 /100 | #72 | Exceptional 6.3% |
| Belgians | 97.0 /100 | #73 | Exceptional 6.3% |
| Carpatho Rusyns | 96.9 /100 | #74 | Exceptional 6.3% |
| Immigrants | Jordan | 96.8 /100 | #75 | Exceptional 6.3% |
| Immigrants | Korea | 96.7 /100 | #76 | Exceptional 6.3% |
| Icelanders | 96.6 /100 | #77 | Exceptional 6.3% |
| Asians | 96.4 /100 | #78 | Exceptional 6.3% |
| Immigrants | Switzerland | 96.0 /100 | #79 | Exceptional 6.3% |
| Immigrants | Romania | 95.9 /100 | #80 | Exceptional 6.3% |
| Iranians | 95.8 /100 | #81 | Exceptional 6.3% |