Assyrian/Chaldean/Syriac vs Carpatho Rusyn Unemployment Among Ages 25 to 29 years
COMPARE
Assyrian/Chaldean/Syriac
Carpatho Rusyn
Unemployment Among Ages 25 to 29 years
Unemployment Among Ages 25 to 29 years Comparison
Assyrians/Chaldeans/Syriacs
Carpatho Rusyns
7.3%
UNEMPLOYMENT AMONG AGES 25 TO 29 YEARS
0.2/ 100
METRIC RATING
257th/ 347
METRIC RANK
6.3%
UNEMPLOYMENT AMONG AGES 25 TO 29 YEARS
96.9/ 100
METRIC RATING
74th/ 347
METRIC RANK
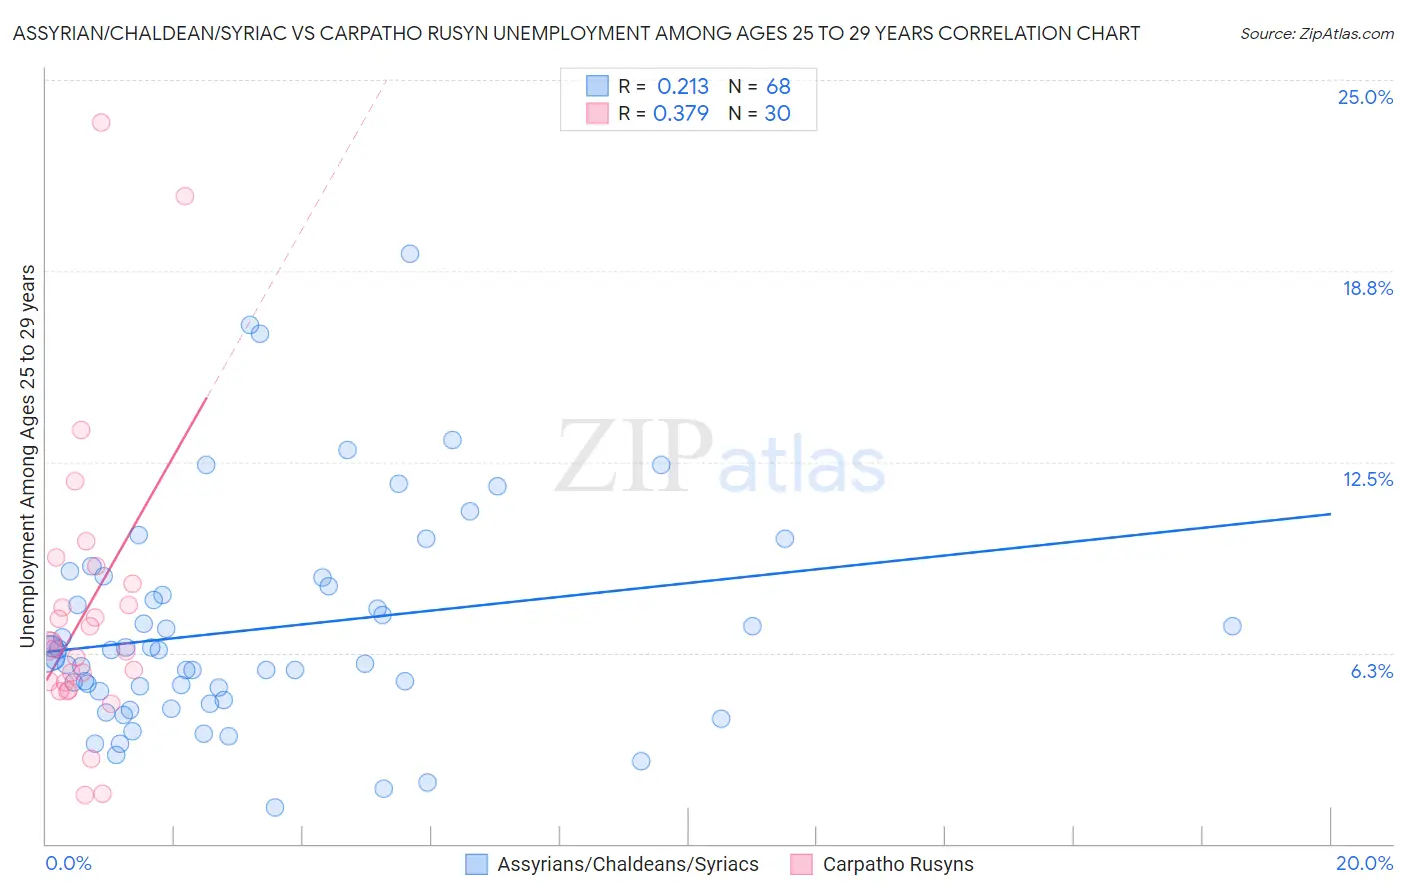
Assyrian/Chaldean/Syriac vs Carpatho Rusyn Unemployment Among Ages 25 to 29 years Correlation Chart
The statistical analysis conducted on geographies consisting of 108,796,100 people shows a weak positive correlation between the proportion of Assyrians/Chaldeans/Syriacs and unemployment rate among population between the ages 25 and 29 in the United States with a correlation coefficient (R) of 0.213 and weighted average of 7.3%. Similarly, the statistical analysis conducted on geographies consisting of 57,767,148 people shows a mild positive correlation between the proportion of Carpatho Rusyns and unemployment rate among population between the ages 25 and 29 in the United States with a correlation coefficient (R) of 0.379 and weighted average of 6.3%, a difference of 15.8%.
Unemployment Among Ages 25 to 29 years Correlation Summary
| Measurement | Assyrian/Chaldean/Syriac | Carpatho Rusyn |
| Minimum | 1.2% | 1.6% |
| Maximum | 19.3% | 23.6% |
| Range | 18.1% | 22.0% |
| Mean | 7.0% | 7.7% |
| Median | 6.3% | 6.4% |
| Interquartile 25% (IQ1) | 4.8% | 5.3% |
| Interquartile 75% (IQ3) | 8.6% | 8.5% |
| Interquartile Range (IQR) | 3.7% | 3.2% |
| Standard Deviation (Sample) | 3.6% | 4.8% |
| Standard Deviation (Population) | 3.6% | 4.7% |
Similar Demographics by Unemployment Among Ages 25 to 29 years
Demographics Similar to Assyrians/Chaldeans/Syriacs by Unemployment Among Ages 25 to 29 years
In terms of unemployment among ages 25 to 29 years, the demographic groups most similar to Assyrians/Chaldeans/Syriacs are Mexican American Indian (7.3%, a difference of 0.37%), Ottawa (7.3%, a difference of 0.40%), Immigrants from Cameroon (7.2%, a difference of 0.57%), Cree (7.3%, a difference of 0.61%), and Ghanaian (7.2%, a difference of 0.63%).
| Demographics | Rating | Rank | Unemployment Among Ages 25 to 29 years |
| Delaware | 0.5 /100 | #250 | Tragic 7.2% |
| Portuguese | 0.5 /100 | #251 | Tragic 7.2% |
| Sierra Leoneans | 0.4 /100 | #252 | Tragic 7.2% |
| Immigrants | Portugal | 0.3 /100 | #253 | Tragic 7.2% |
| Ghanaians | 0.3 /100 | #254 | Tragic 7.2% |
| Immigrants | Cameroon | 0.3 /100 | #255 | Tragic 7.2% |
| Mexican American Indians | 0.3 /100 | #256 | Tragic 7.3% |
| Assyrians/Chaldeans/Syriacs | 0.2 /100 | #257 | Tragic 7.3% |
| Ottawa | 0.1 /100 | #258 | Tragic 7.3% |
| Cree | 0.1 /100 | #259 | Tragic 7.3% |
| Americans | 0.1 /100 | #260 | Tragic 7.4% |
| Nigerians | 0.1 /100 | #261 | Tragic 7.4% |
| Ecuadorians | 0.1 /100 | #262 | Tragic 7.4% |
| Kiowa | 0.1 /100 | #263 | Tragic 7.4% |
| Immigrants | Western Africa | 0.1 /100 | #264 | Tragic 7.4% |
Demographics Similar to Carpatho Rusyns by Unemployment Among Ages 25 to 29 years
In terms of unemployment among ages 25 to 29 years, the demographic groups most similar to Carpatho Rusyns are Belgian (6.3%, a difference of 0.020%), Immigrants from Jordan (6.3%, a difference of 0.070%), Immigrants from Korea (6.3%, a difference of 0.13%), Icelander (6.3%, a difference of 0.16%), and Asian (6.3%, a difference of 0.25%).
| Demographics | Rating | Rank | Unemployment Among Ages 25 to 29 years |
| Immigrants | Northern Africa | 97.8 /100 | #67 | Exceptional 6.3% |
| Palestinians | 97.7 /100 | #68 | Exceptional 6.3% |
| Immigrants | Hong Kong | 97.5 /100 | #69 | Exceptional 6.3% |
| Immigrants | Malaysia | 97.5 /100 | #70 | Exceptional 6.3% |
| Immigrants | France | 97.4 /100 | #71 | Exceptional 6.3% |
| Scandinavians | 97.4 /100 | #72 | Exceptional 6.3% |
| Belgians | 97.0 /100 | #73 | Exceptional 6.3% |
| Carpatho Rusyns | 96.9 /100 | #74 | Exceptional 6.3% |
| Immigrants | Jordan | 96.8 /100 | #75 | Exceptional 6.3% |
| Immigrants | Korea | 96.7 /100 | #76 | Exceptional 6.3% |
| Icelanders | 96.6 /100 | #77 | Exceptional 6.3% |
| Asians | 96.4 /100 | #78 | Exceptional 6.3% |
| Immigrants | Switzerland | 96.0 /100 | #79 | Exceptional 6.3% |
| Immigrants | Romania | 95.9 /100 | #80 | Exceptional 6.3% |
| Iranians | 95.8 /100 | #81 | Exceptional 6.3% |