Immigrants from the Azores vs Carpatho Rusyn Unemployment Among Ages 25 to 29 years
COMPARE
Immigrants from the Azores
Carpatho Rusyn
Unemployment Among Ages 25 to 29 years
Unemployment Among Ages 25 to 29 years Comparison
Immigrants from the Azores
Carpatho Rusyns
8.1%
UNEMPLOYMENT AMONG AGES 25 TO 29 YEARS
0.0/ 100
METRIC RATING
311th/ 347
METRIC RANK
6.3%
UNEMPLOYMENT AMONG AGES 25 TO 29 YEARS
96.9/ 100
METRIC RATING
74th/ 347
METRIC RANK
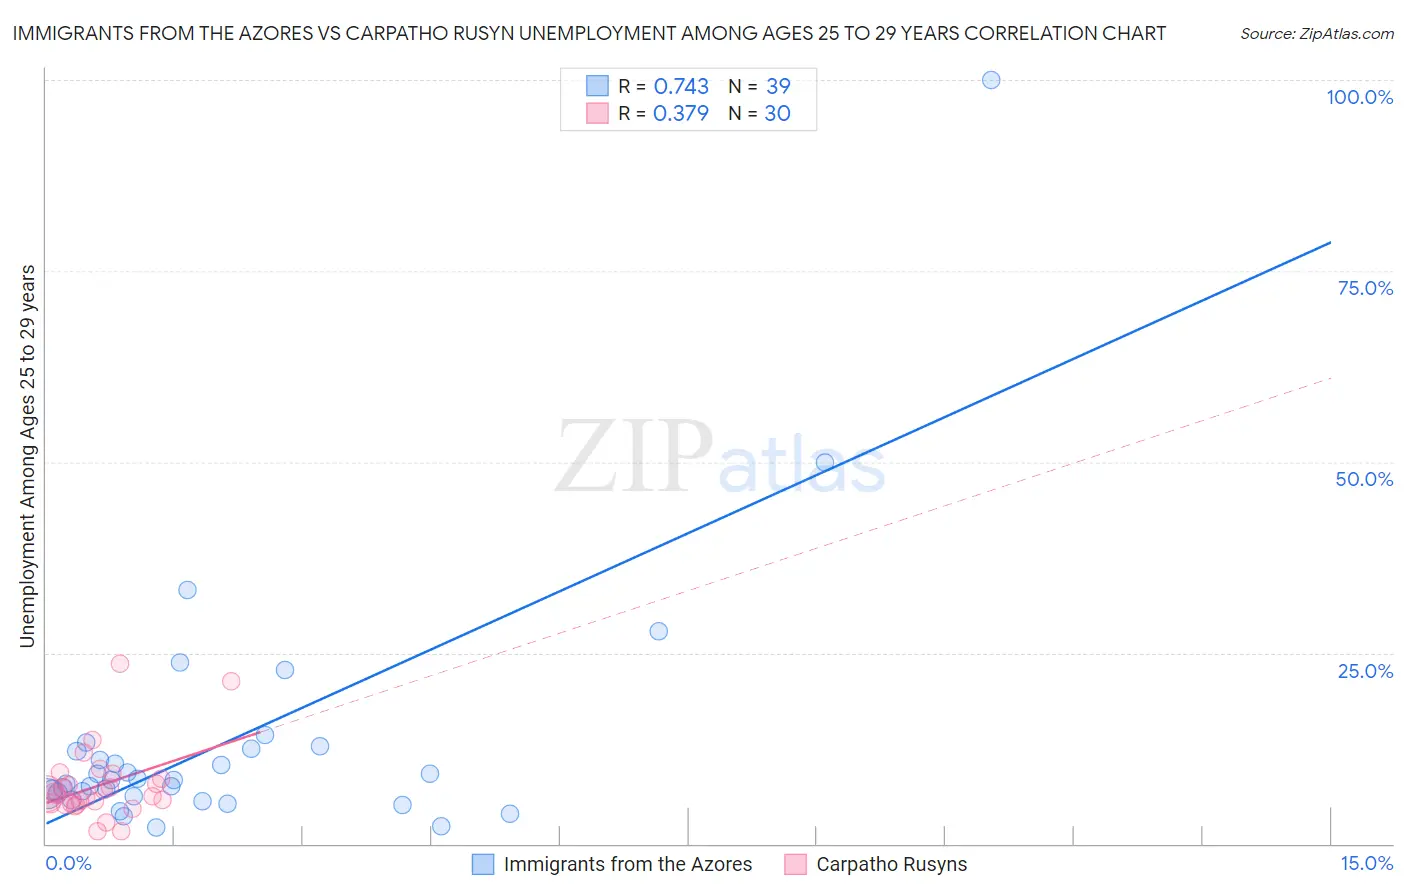
Immigrants from the Azores vs Carpatho Rusyn Unemployment Among Ages 25 to 29 years Correlation Chart
The statistical analysis conducted on geographies consisting of 45,622,335 people shows a strong positive correlation between the proportion of Immigrants from the Azores and unemployment rate among population between the ages 25 and 29 in the United States with a correlation coefficient (R) of 0.743 and weighted average of 8.1%. Similarly, the statistical analysis conducted on geographies consisting of 57,767,148 people shows a mild positive correlation between the proportion of Carpatho Rusyns and unemployment rate among population between the ages 25 and 29 in the United States with a correlation coefficient (R) of 0.379 and weighted average of 6.3%, a difference of 28.7%.
Unemployment Among Ages 25 to 29 years Correlation Summary
| Measurement | Immigrants from the Azores | Carpatho Rusyn |
| Minimum | 2.1% | 1.6% |
| Maximum | 100.0% | 23.6% |
| Range | 97.9% | 22.0% |
| Mean | 13.2% | 7.7% |
| Median | 8.4% | 6.4% |
| Interquartile 25% (IQ1) | 6.2% | 5.3% |
| Interquartile 75% (IQ3) | 12.5% | 8.5% |
| Interquartile Range (IQR) | 6.3% | 3.2% |
| Standard Deviation (Sample) | 17.0% | 4.8% |
| Standard Deviation (Population) | 16.8% | 4.7% |
Similar Demographics by Unemployment Among Ages 25 to 29 years
Demographics Similar to Immigrants from the Azores by Unemployment Among Ages 25 to 29 years
In terms of unemployment among ages 25 to 29 years, the demographic groups most similar to Immigrants from the Azores are U.S. Virgin Islander (8.1%, a difference of 0.24%), Immigrants from Haiti (8.1%, a difference of 0.25%), Immigrants from Jamaica (8.1%, a difference of 0.26%), Immigrants from Barbados (8.0%, a difference of 0.68%), and Haitian (8.0%, a difference of 0.85%).
| Demographics | Rating | Rank | Unemployment Among Ages 25 to 29 years |
| Cajuns | 0.0 /100 | #304 | Tragic 8.0% |
| Tsimshian | 0.0 /100 | #305 | Tragic 8.0% |
| Haitians | 0.0 /100 | #306 | Tragic 8.0% |
| Immigrants | Barbados | 0.0 /100 | #307 | Tragic 8.0% |
| Immigrants | Jamaica | 0.0 /100 | #308 | Tragic 8.1% |
| Immigrants | Haiti | 0.0 /100 | #309 | Tragic 8.1% |
| U.S. Virgin Islanders | 0.0 /100 | #310 | Tragic 8.1% |
| Immigrants | Azores | 0.0 /100 | #311 | Tragic 8.1% |
| Dutch West Indians | 0.0 /100 | #312 | Tragic 8.2% |
| Immigrants | St. Vincent and the Grenadines | 0.0 /100 | #313 | Tragic 8.4% |
| Immigrants | Dominica | 0.0 /100 | #314 | Tragic 8.4% |
| British West Indians | 0.0 /100 | #315 | Tragic 8.4% |
| Immigrants | Grenada | 0.0 /100 | #316 | Tragic 8.4% |
| Immigrants | Guyana | 0.0 /100 | #317 | Tragic 8.5% |
| Guyanese | 0.0 /100 | #318 | Tragic 8.5% |
Demographics Similar to Carpatho Rusyns by Unemployment Among Ages 25 to 29 years
In terms of unemployment among ages 25 to 29 years, the demographic groups most similar to Carpatho Rusyns are Belgian (6.3%, a difference of 0.020%), Immigrants from Jordan (6.3%, a difference of 0.070%), Immigrants from Korea (6.3%, a difference of 0.13%), Icelander (6.3%, a difference of 0.16%), and Asian (6.3%, a difference of 0.25%).
| Demographics | Rating | Rank | Unemployment Among Ages 25 to 29 years |
| Immigrants | Northern Africa | 97.8 /100 | #67 | Exceptional 6.3% |
| Palestinians | 97.7 /100 | #68 | Exceptional 6.3% |
| Immigrants | Hong Kong | 97.5 /100 | #69 | Exceptional 6.3% |
| Immigrants | Malaysia | 97.5 /100 | #70 | Exceptional 6.3% |
| Immigrants | France | 97.4 /100 | #71 | Exceptional 6.3% |
| Scandinavians | 97.4 /100 | #72 | Exceptional 6.3% |
| Belgians | 97.0 /100 | #73 | Exceptional 6.3% |
| Carpatho Rusyns | 96.9 /100 | #74 | Exceptional 6.3% |
| Immigrants | Jordan | 96.8 /100 | #75 | Exceptional 6.3% |
| Immigrants | Korea | 96.7 /100 | #76 | Exceptional 6.3% |
| Icelanders | 96.6 /100 | #77 | Exceptional 6.3% |
| Asians | 96.4 /100 | #78 | Exceptional 6.3% |
| Immigrants | Switzerland | 96.0 /100 | #79 | Exceptional 6.3% |
| Immigrants | Romania | 95.9 /100 | #80 | Exceptional 6.3% |
| Iranians | 95.8 /100 | #81 | Exceptional 6.3% |