Lithuanian vs Assyrian/Chaldean/Syriac Unemployment Among Ages 45 to 54 years
COMPARE
Lithuanian
Assyrian/Chaldean/Syriac
Unemployment Among Ages 45 to 54 years
Unemployment Among Ages 45 to 54 years Comparison
Lithuanians
Assyrians/Chaldeans/Syriacs
4.3%
UNEMPLOYMENT AMONG AGES 45 TO 54 YEARS
99.1/ 100
METRIC RATING
62nd/ 347
METRIC RANK
4.7%
UNEMPLOYMENT AMONG AGES 45 TO 54 YEARS
3.5/ 100
METRIC RATING
226th/ 347
METRIC RANK
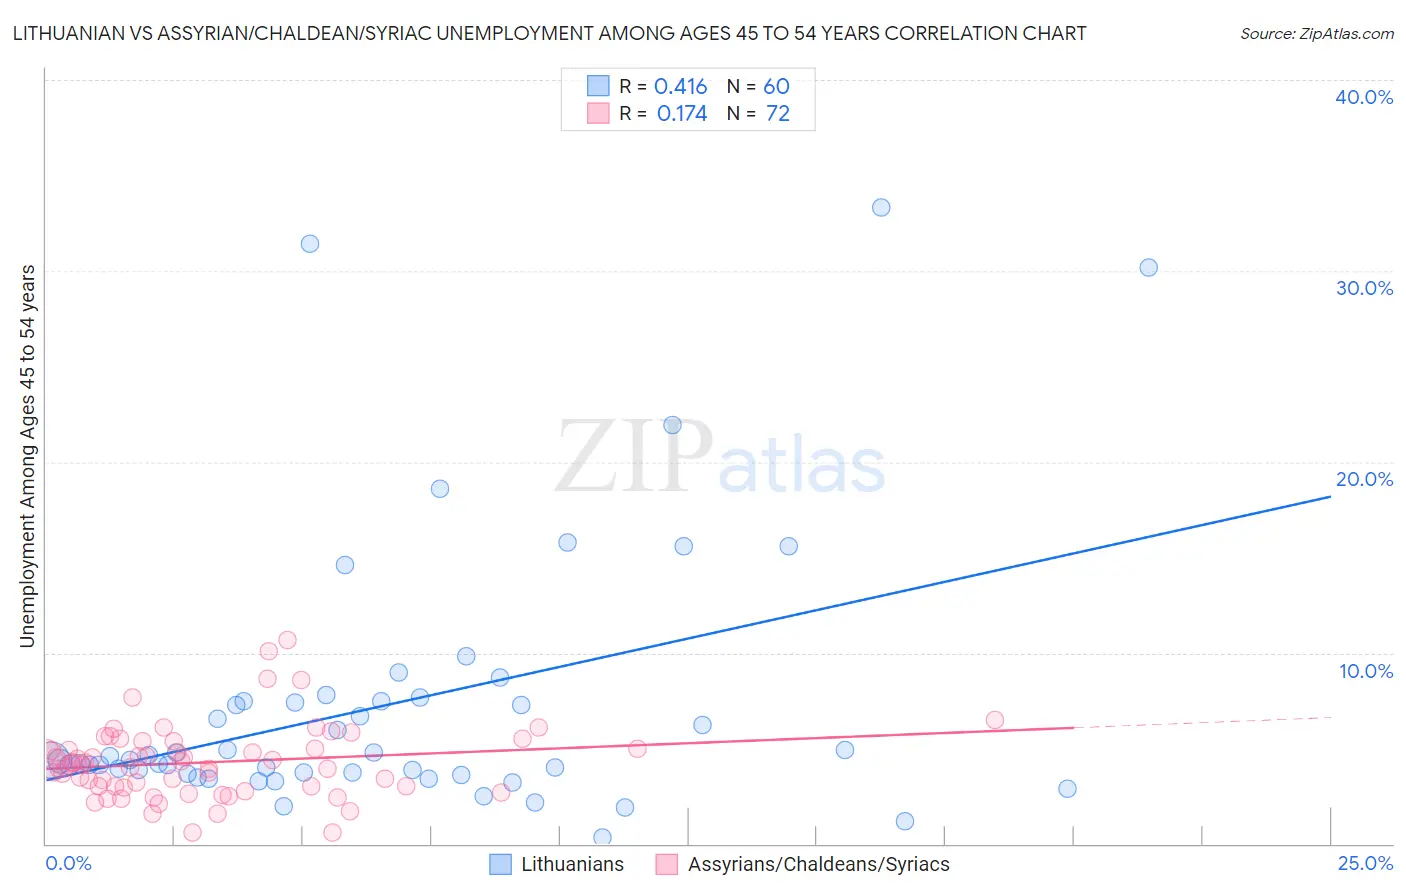
Lithuanian vs Assyrian/Chaldean/Syriac Unemployment Among Ages 45 to 54 years Correlation Chart
The statistical analysis conducted on geographies consisting of 407,579,689 people shows a moderate positive correlation between the proportion of Lithuanians and unemployment rate among population between the ages 45 and 54 in the United States with a correlation coefficient (R) of 0.416 and weighted average of 4.3%. Similarly, the statistical analysis conducted on geographies consisting of 109,531,563 people shows a poor positive correlation between the proportion of Assyrians/Chaldeans/Syriacs and unemployment rate among population between the ages 45 and 54 in the United States with a correlation coefficient (R) of 0.174 and weighted average of 4.7%, a difference of 10.0%.
Unemployment Among Ages 45 to 54 years Correlation Summary
| Measurement | Lithuanian | Assyrian/Chaldean/Syriac |
| Minimum | 0.30% | 0.60% |
| Maximum | 33.3% | 10.7% |
| Range | 33.0% | 10.1% |
| Mean | 7.3% | 4.3% |
| Median | 4.4% | 4.2% |
| Interquartile 25% (IQ1) | 3.7% | 3.0% |
| Interquartile 75% (IQ3) | 7.5% | 5.2% |
| Interquartile Range (IQR) | 3.8% | 2.2% |
| Standard Deviation (Sample) | 7.1% | 1.9% |
| Standard Deviation (Population) | 7.0% | 1.9% |
Similar Demographics by Unemployment Among Ages 45 to 54 years
Demographics Similar to Lithuanians by Unemployment Among Ages 45 to 54 years
In terms of unemployment among ages 45 to 54 years, the demographic groups most similar to Lithuanians are Pennsylvania German (4.3%, a difference of 0.090%), Immigrants from Korea (4.3%, a difference of 0.14%), Immigrants from Pakistan (4.3%, a difference of 0.14%), Okinawan (4.3%, a difference of 0.17%), and Austrian (4.3%, a difference of 0.19%).
| Demographics | Rating | Rank | Unemployment Among Ages 45 to 54 years |
| Latvians | 99.4 /100 | #55 | Exceptional 4.2% |
| Immigrants | Jordan | 99.3 /100 | #56 | Exceptional 4.3% |
| Immigrants | Sri Lanka | 99.3 /100 | #57 | Exceptional 4.3% |
| Greeks | 99.3 /100 | #58 | Exceptional 4.3% |
| Okinawans | 99.2 /100 | #59 | Exceptional 4.3% |
| Immigrants | Korea | 99.2 /100 | #60 | Exceptional 4.3% |
| Immigrants | Pakistan | 99.2 /100 | #61 | Exceptional 4.3% |
| Lithuanians | 99.1 /100 | #62 | Exceptional 4.3% |
| Pennsylvania Germans | 99.1 /100 | #63 | Exceptional 4.3% |
| Austrians | 99.0 /100 | #64 | Exceptional 4.3% |
| Immigrants | Sudan | 99.0 /100 | #65 | Exceptional 4.3% |
| Turks | 98.9 /100 | #66 | Exceptional 4.3% |
| Immigrants | Nepal | 98.9 /100 | #67 | Exceptional 4.3% |
| Slovaks | 98.8 /100 | #68 | Exceptional 4.3% |
| Immigrants | Japan | 98.7 /100 | #69 | Exceptional 4.3% |
Demographics Similar to Assyrians/Chaldeans/Syriacs by Unemployment Among Ages 45 to 54 years
In terms of unemployment among ages 45 to 54 years, the demographic groups most similar to Assyrians/Chaldeans/Syriacs are Iraqi (4.7%, a difference of 0.090%), South American Indian (4.7%, a difference of 0.12%), Immigrants from Israel (4.7%, a difference of 0.17%), Japanese (4.7%, a difference of 0.25%), and Immigrants from Ireland (4.7%, a difference of 0.29%).
| Demographics | Rating | Rank | Unemployment Among Ages 45 to 54 years |
| Nigerians | 7.0 /100 | #219 | Tragic 4.7% |
| Guamanians/Chamorros | 6.8 /100 | #220 | Tragic 4.7% |
| Choctaw | 6.1 /100 | #221 | Tragic 4.7% |
| Immigrants | Southern Europe | 6.0 /100 | #222 | Tragic 4.7% |
| Potawatomi | 5.7 /100 | #223 | Tragic 4.7% |
| Comanche | 4.8 /100 | #224 | Tragic 4.7% |
| Immigrants | Norway | 4.8 /100 | #225 | Tragic 4.7% |
| Assyrians/Chaldeans/Syriacs | 3.5 /100 | #226 | Tragic 4.7% |
| Iraqis | 3.2 /100 | #227 | Tragic 4.7% |
| South American Indians | 3.1 /100 | #228 | Tragic 4.7% |
| Immigrants | Israel | 3.0 /100 | #229 | Tragic 4.7% |
| Japanese | 2.8 /100 | #230 | Tragic 4.7% |
| Immigrants | Ireland | 2.7 /100 | #231 | Tragic 4.7% |
| Ottawa | 2.7 /100 | #232 | Tragic 4.7% |
| Immigrants | Immigrants | 2.6 /100 | #233 | Tragic 4.7% |