Sri Lankan vs Immigrants from Canada Unemployment Among Ages 55 to 59 years
COMPARE
Sri Lankan
Immigrants from Canada
Unemployment Among Ages 55 to 59 years
Unemployment Among Ages 55 to 59 years Comparison
Sri Lankans
Immigrants from Canada
4.6%
UNEMPLOYMENT AMONG AGES 55 TO 59 YEARS
98.1/ 100
METRIC RATING
79th/ 347
METRIC RANK
4.7%
UNEMPLOYMENT AMONG AGES 55 TO 59 YEARS
94.9/ 100
METRIC RATING
97th/ 347
METRIC RANK
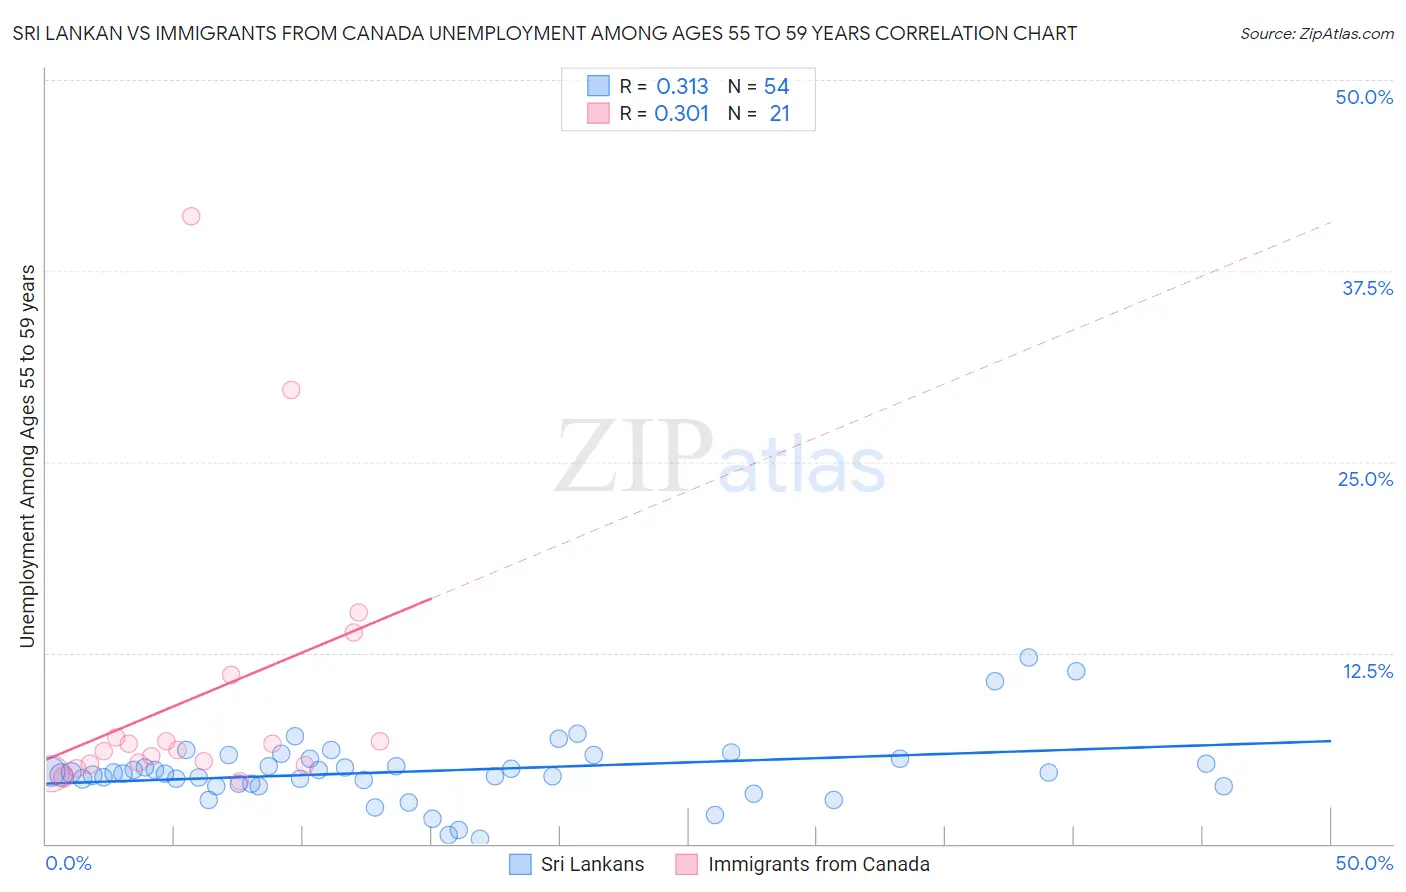
Sri Lankan vs Immigrants from Canada Unemployment Among Ages 55 to 59 years Correlation Chart
The statistical analysis conducted on geographies consisting of 406,595,249 people shows a mild positive correlation between the proportion of Sri Lankans and unemployment rate among population between the ages 55 and 59 in the United States with a correlation coefficient (R) of 0.313 and weighted average of 4.6%. Similarly, the statistical analysis conducted on geographies consisting of 417,489,457 people shows a mild positive correlation between the proportion of Immigrants from Canada and unemployment rate among population between the ages 55 and 59 in the United States with a correlation coefficient (R) of 0.301 and weighted average of 4.7%, a difference of 1.1%.
Unemployment Among Ages 55 to 59 years Correlation Summary
| Measurement | Sri Lankan | Immigrants from Canada |
| Minimum | 0.30% | 4.1% |
| Maximum | 12.2% | 41.1% |
| Range | 11.9% | 37.0% |
| Mean | 4.8% | 9.6% |
| Median | 4.6% | 6.1% |
| Interquartile 25% (IQ1) | 3.9% | 5.2% |
| Interquartile 75% (IQ3) | 5.5% | 9.0% |
| Interquartile Range (IQR) | 1.6% | 3.8% |
| Standard Deviation (Sample) | 2.2% | 9.2% |
| Standard Deviation (Population) | 2.2% | 9.0% |
Demographics Similar to Sri Lankans and Immigrants from Canada by Unemployment Among Ages 55 to 59 years
In terms of unemployment among ages 55 to 59 years, the demographic groups most similar to Sri Lankans are Cambodian (4.6%, a difference of 0.040%), Finnish (4.6%, a difference of 0.090%), Taiwanese (4.6%, a difference of 0.11%), Latvian (4.6%, a difference of 0.16%), and Lebanese (4.6%, a difference of 0.28%). Similarly, the demographic groups most similar to Immigrants from Canada are Immigrants from Belgium (4.7%, a difference of 0.010%), Immigrants from Germany (4.7%, a difference of 0.010%), South African (4.7%, a difference of 0.17%), Immigrants from Scotland (4.7%, a difference of 0.20%), and Immigrants from England (4.7%, a difference of 0.21%).
| Demographics | Rating | Rank | Unemployment Among Ages 55 to 59 years |
| Finns | 98.2 /100 | #78 | Exceptional 4.6% |
| Sri Lankans | 98.1 /100 | #79 | Exceptional 4.6% |
| Cambodians | 98.0 /100 | #80 | Exceptional 4.6% |
| Taiwanese | 97.9 /100 | #81 | Exceptional 4.6% |
| Latvians | 97.8 /100 | #82 | Exceptional 4.6% |
| Lebanese | 97.5 /100 | #83 | Exceptional 4.6% |
| Malaysians | 96.9 /100 | #84 | Exceptional 4.7% |
| Immigrants | Vietnam | 96.9 /100 | #85 | Exceptional 4.7% |
| Immigrants | Colombia | 96.9 /100 | #86 | Exceptional 4.7% |
| Poles | 96.9 /100 | #87 | Exceptional 4.7% |
| Immigrants | Cameroon | 96.9 /100 | #88 | Exceptional 4.7% |
| Irish | 96.8 /100 | #89 | Exceptional 4.7% |
| Immigrants | Poland | 96.4 /100 | #90 | Exceptional 4.7% |
| New Zealanders | 96.3 /100 | #91 | Exceptional 4.7% |
| Iraqis | 96.1 /100 | #92 | Exceptional 4.7% |
| Immigrants | England | 95.8 /100 | #93 | Exceptional 4.7% |
| Immigrants | Scotland | 95.7 /100 | #94 | Exceptional 4.7% |
| South Africans | 95.6 /100 | #95 | Exceptional 4.7% |
| Immigrants | Belgium | 95.0 /100 | #96 | Exceptional 4.7% |
| Immigrants | Canada | 94.9 /100 | #97 | Exceptional 4.7% |
| Immigrants | Germany | 94.8 /100 | #98 | Exceptional 4.7% |