Sri Lankan vs Slovene Unemployment Among Ages 55 to 59 years
COMPARE
Sri Lankan
Slovene
Unemployment Among Ages 55 to 59 years
Unemployment Among Ages 55 to 59 years Comparison
Sri Lankans
Slovenes
4.6%
UNEMPLOYMENT AMONG AGES 55 TO 59 YEARS
98.1/ 100
METRIC RATING
79th/ 347
METRIC RANK
4.6%
UNEMPLOYMENT AMONG AGES 55 TO 59 YEARS
99.3/ 100
METRIC RATING
62nd/ 347
METRIC RANK
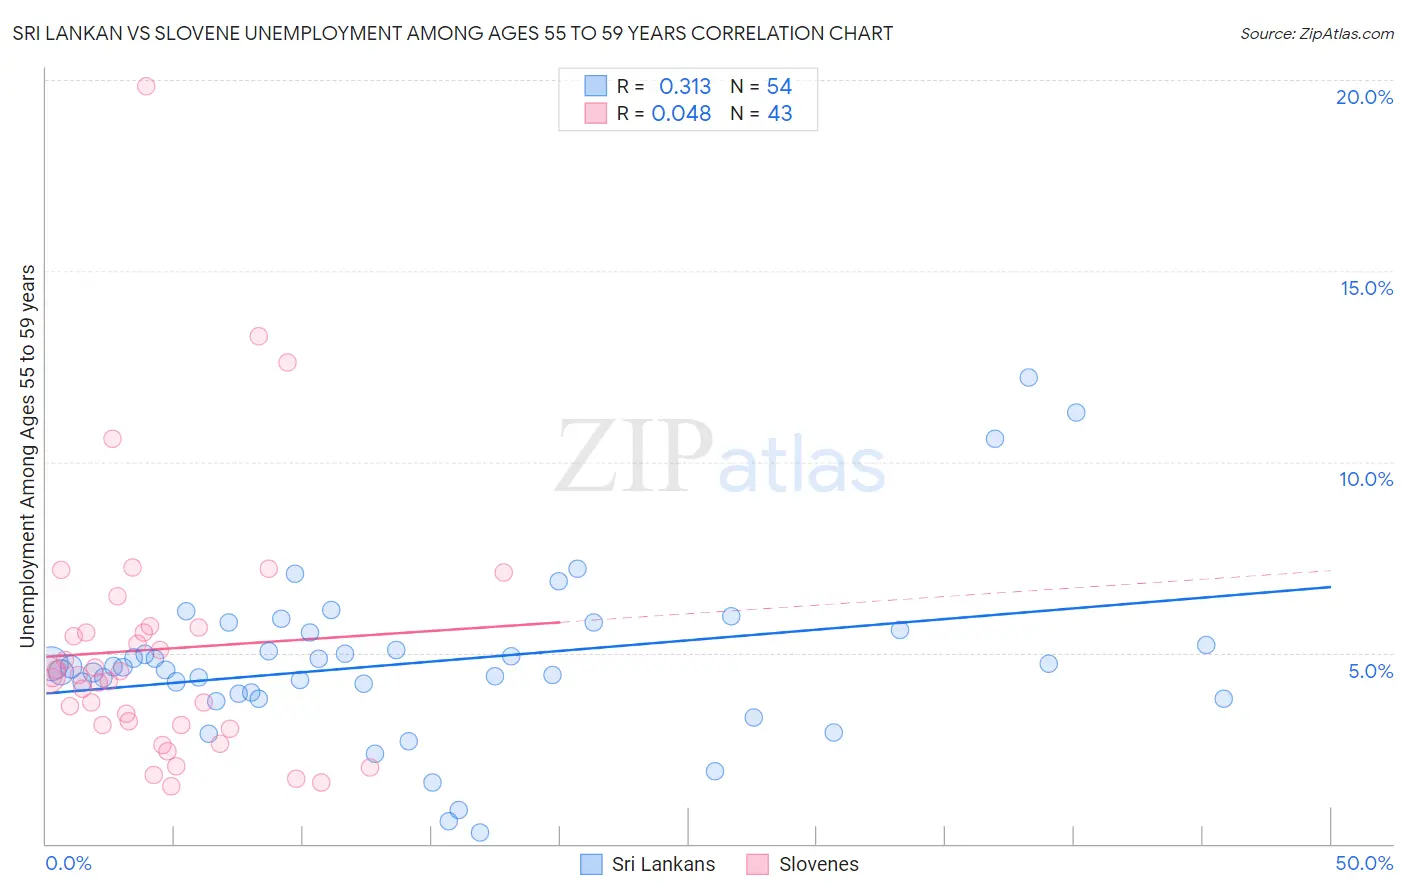
Sri Lankan vs Slovene Unemployment Among Ages 55 to 59 years Correlation Chart
The statistical analysis conducted on geographies consisting of 406,595,249 people shows a mild positive correlation between the proportion of Sri Lankans and unemployment rate among population between the ages 55 and 59 in the United States with a correlation coefficient (R) of 0.313 and weighted average of 4.6%. Similarly, the statistical analysis conducted on geographies consisting of 247,033,366 people shows no correlation between the proportion of Slovenes and unemployment rate among population between the ages 55 and 59 in the United States with a correlation coefficient (R) of 0.048 and weighted average of 4.6%, a difference of 1.1%.
Unemployment Among Ages 55 to 59 years Correlation Summary
| Measurement | Sri Lankan | Slovene |
| Minimum | 0.30% | 1.5% |
| Maximum | 12.2% | 19.8% |
| Range | 11.9% | 18.3% |
| Mean | 4.8% | 5.1% |
| Median | 4.6% | 4.4% |
| Interquartile 25% (IQ1) | 3.9% | 3.1% |
| Interquartile 75% (IQ3) | 5.5% | 5.7% |
| Interquartile Range (IQR) | 1.6% | 2.5% |
| Standard Deviation (Sample) | 2.2% | 3.5% |
| Standard Deviation (Population) | 2.2% | 3.4% |
Demographics Similar to Sri Lankans and Slovenes by Unemployment Among Ages 55 to 59 years
In terms of unemployment among ages 55 to 59 years, the demographic groups most similar to Sri Lankans are Cambodian (4.6%, a difference of 0.040%), Finnish (4.6%, a difference of 0.090%), Scotch-Irish (4.6%, a difference of 0.14%), Immigrants from Bosnia and Herzegovina (4.6%, a difference of 0.15%), and Immigrants from Iraq (4.6%, a difference of 0.22%). Similarly, the demographic groups most similar to Slovenes are Immigrants from South Central Asia (4.6%, a difference of 0.080%), Immigrants from Argentina (4.6%, a difference of 0.25%), Argentinean (4.6%, a difference of 0.26%), Sudanese (4.6%, a difference of 0.27%), and Dutch (4.6%, a difference of 0.34%).
| Demographics | Rating | Rank | Unemployment Among Ages 55 to 59 years |
| Dutch | 99.5 /100 | #60 | Exceptional 4.6% |
| Immigrants | Argentina | 99.5 /100 | #61 | Exceptional 4.6% |
| Slovenes | 99.3 /100 | #62 | Exceptional 4.6% |
| Immigrants | South Central Asia | 99.3 /100 | #63 | Exceptional 4.6% |
| Argentineans | 99.1 /100 | #64 | Exceptional 4.6% |
| Sudanese | 99.1 /100 | #65 | Exceptional 4.6% |
| Mongolians | 99.0 /100 | #66 | Exceptional 4.6% |
| Ugandans | 99.0 /100 | #67 | Exceptional 4.6% |
| Immigrants | Micronesia | 99.0 /100 | #68 | Exceptional 4.6% |
| Czechoslovakians | 99.0 /100 | #69 | Exceptional 4.6% |
| Filipinos | 98.8 /100 | #70 | Exceptional 4.6% |
| Immigrants | Jordan | 98.7 /100 | #71 | Exceptional 4.6% |
| Immigrants | Taiwan | 98.7 /100 | #72 | Exceptional 4.6% |
| Bhutanese | 98.6 /100 | #73 | Exceptional 4.6% |
| Croatians | 98.5 /100 | #74 | Exceptional 4.6% |
| Immigrants | Iraq | 98.5 /100 | #75 | Exceptional 4.6% |
| Immigrants | Bosnia and Herzegovina | 98.3 /100 | #76 | Exceptional 4.6% |
| Scotch-Irish | 98.3 /100 | #77 | Exceptional 4.6% |
| Finns | 98.2 /100 | #78 | Exceptional 4.6% |
| Sri Lankans | 98.1 /100 | #79 | Exceptional 4.6% |
| Cambodians | 98.0 /100 | #80 | Exceptional 4.6% |