Sri Lankan vs Immigrants from Canada 9th Grade
COMPARE
Sri Lankan
Immigrants from Canada
9th Grade
9th Grade Comparison
Sri Lankans
Immigrants from Canada
93.2%
9TH GRADE
0.0/ 100
METRIC RATING
293rd/ 347
METRIC RANK
96.0%
9TH GRADE
99.8/ 100
METRIC RATING
54th/ 347
METRIC RANK
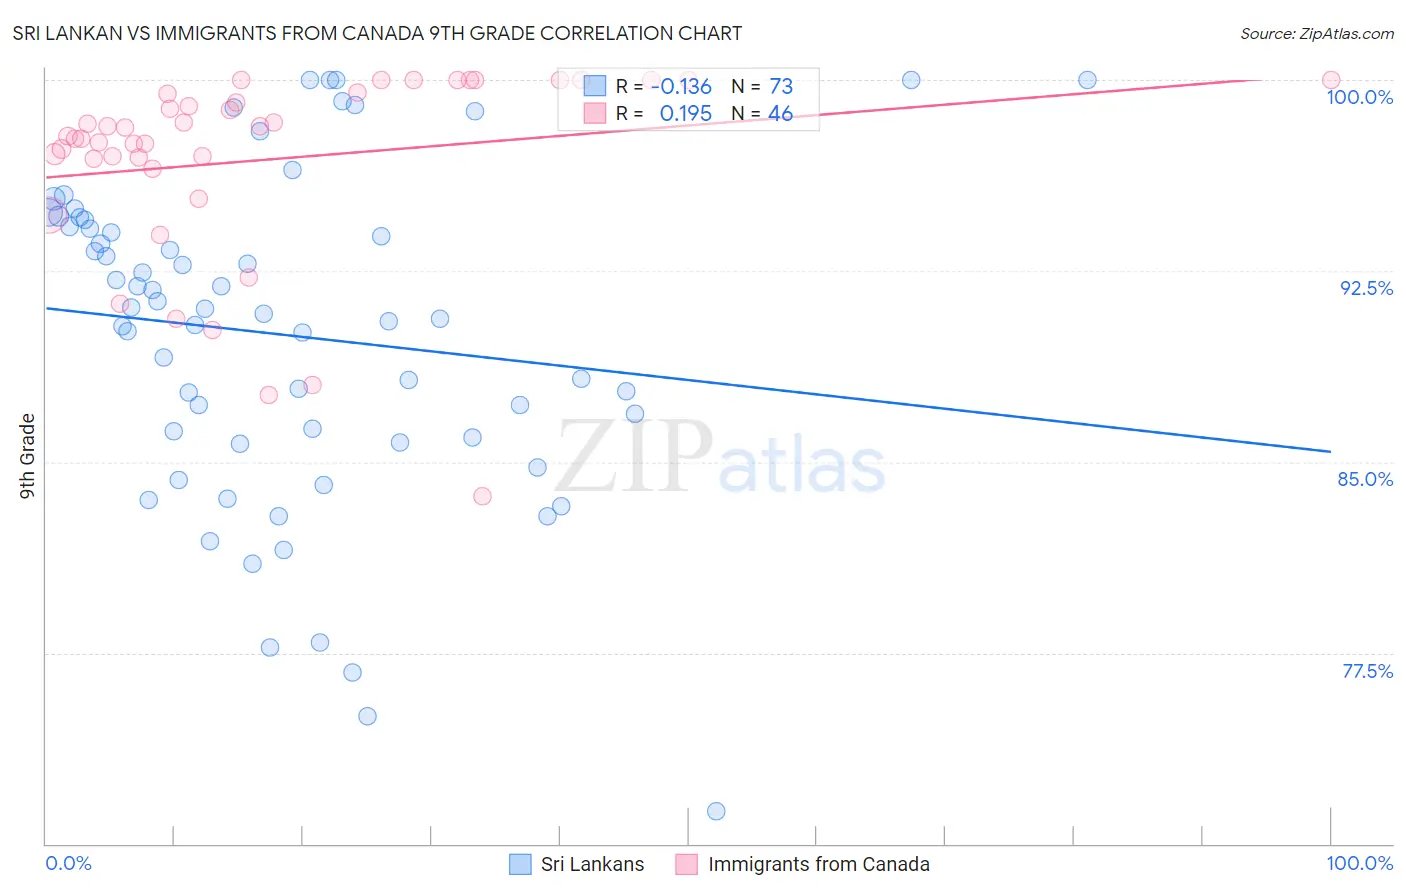
Sri Lankan vs Immigrants from Canada 9th Grade Correlation Chart
The statistical analysis conducted on geographies consisting of 440,593,537 people shows a poor negative correlation between the proportion of Sri Lankans and percentage of population with at least 9th grade education in the United States with a correlation coefficient (R) of -0.136 and weighted average of 93.2%. Similarly, the statistical analysis conducted on geographies consisting of 459,397,383 people shows a poor positive correlation between the proportion of Immigrants from Canada and percentage of population with at least 9th grade education in the United States with a correlation coefficient (R) of 0.195 and weighted average of 96.0%, a difference of 3.0%.
9th Grade Correlation Summary
| Measurement | Sri Lankan | Immigrants from Canada |
| Minimum | 71.3% | 83.7% |
| Maximum | 100.0% | 100.0% |
| Range | 28.7% | 16.3% |
| Mean | 90.0% | 96.9% |
| Median | 90.8% | 98.0% |
| Interquartile 25% (IQ1) | 85.9% | 96.9% |
| Interquartile 75% (IQ3) | 94.4% | 99.5% |
| Interquartile Range (IQR) | 8.5% | 2.6% |
| Standard Deviation (Sample) | 6.4% | 3.8% |
| Standard Deviation (Population) | 6.4% | 3.7% |
Similar Demographics by 9th Grade
Demographics Similar to Sri Lankans by 9th Grade
In terms of 9th grade, the demographic groups most similar to Sri Lankans are Cuban (93.2%, a difference of 0.0%), Immigrants from Laos (93.2%, a difference of 0.010%), Immigrants from Burma/Myanmar (93.1%, a difference of 0.020%), British West Indian (93.2%, a difference of 0.030%), and Indonesian (93.1%, a difference of 0.030%).
| Demographics | Rating | Rank | 9th Grade |
| Immigrants | Barbados | 0.0 /100 | #286 | Tragic 93.4% |
| Immigrants | St. Vincent and the Grenadines | 0.0 /100 | #287 | Tragic 93.4% |
| Immigrants | South Eastern Asia | 0.0 /100 | #288 | Tragic 93.3% |
| Immigrants | West Indies | 0.0 /100 | #289 | Tragic 93.3% |
| Pennsylvania Germans | 0.0 /100 | #290 | Tragic 93.3% |
| British West Indians | 0.0 /100 | #291 | Tragic 93.2% |
| Immigrants | Laos | 0.0 /100 | #292 | Tragic 93.2% |
| Sri Lankans | 0.0 /100 | #293 | Tragic 93.2% |
| Cubans | 0.0 /100 | #294 | Tragic 93.2% |
| Immigrants | Burma/Myanmar | 0.0 /100 | #295 | Tragic 93.1% |
| Indonesians | 0.0 /100 | #296 | Tragic 93.1% |
| Fijians | 0.0 /100 | #297 | Tragic 93.1% |
| Haitians | 0.0 /100 | #298 | Tragic 93.1% |
| Immigrants | Grenada | 0.0 /100 | #299 | Tragic 93.0% |
| Yaqui | 0.0 /100 | #300 | Tragic 92.9% |
Demographics Similar to Immigrants from Canada by 9th Grade
In terms of 9th grade, the demographic groups most similar to Immigrants from Canada are Austrian (96.0%, a difference of 0.010%), Immigrants from Austria (96.0%, a difference of 0.010%), Serbian (96.0%, a difference of 0.020%), Immigrants from North America (96.0%, a difference of 0.020%), and Immigrants from Northern Europe (96.0%, a difference of 0.030%).
| Demographics | Rating | Rank | 9th Grade |
| Russians | 99.9 /100 | #47 | Exceptional 96.0% |
| Australians | 99.9 /100 | #48 | Exceptional 96.0% |
| Greeks | 99.9 /100 | #49 | Exceptional 96.0% |
| Celtics | 99.9 /100 | #50 | Exceptional 96.0% |
| Immigrants | Northern Europe | 99.9 /100 | #51 | Exceptional 96.0% |
| Serbians | 99.9 /100 | #52 | Exceptional 96.0% |
| Austrians | 99.8 /100 | #53 | Exceptional 96.0% |
| Immigrants | Canada | 99.8 /100 | #54 | Exceptional 96.0% |
| Immigrants | Austria | 99.8 /100 | #55 | Exceptional 96.0% |
| Immigrants | North America | 99.8 /100 | #56 | Exceptional 96.0% |
| Macedonians | 99.8 /100 | #57 | Exceptional 96.0% |
| Aleuts | 99.8 /100 | #58 | Exceptional 96.0% |
| New Zealanders | 99.8 /100 | #59 | Exceptional 95.9% |
| Native Hawaiians | 99.8 /100 | #60 | Exceptional 95.9% |
| Sioux | 99.8 /100 | #61 | Exceptional 95.9% |