Sri Lankan vs Immigrants from Canada Single Mother Households
COMPARE
Sri Lankan
Immigrants from Canada
Single Mother Households
Single Mother Households Comparison
Sri Lankans
Immigrants from Canada
6.2%
SINGLE MOTHER HOUSEHOLDS
63.9/ 100
METRIC RATING
166th/ 347
METRIC RANK
5.6%
SINGLE MOTHER HOUSEHOLDS
98.5/ 100
METRIC RATING
66th/ 347
METRIC RANK
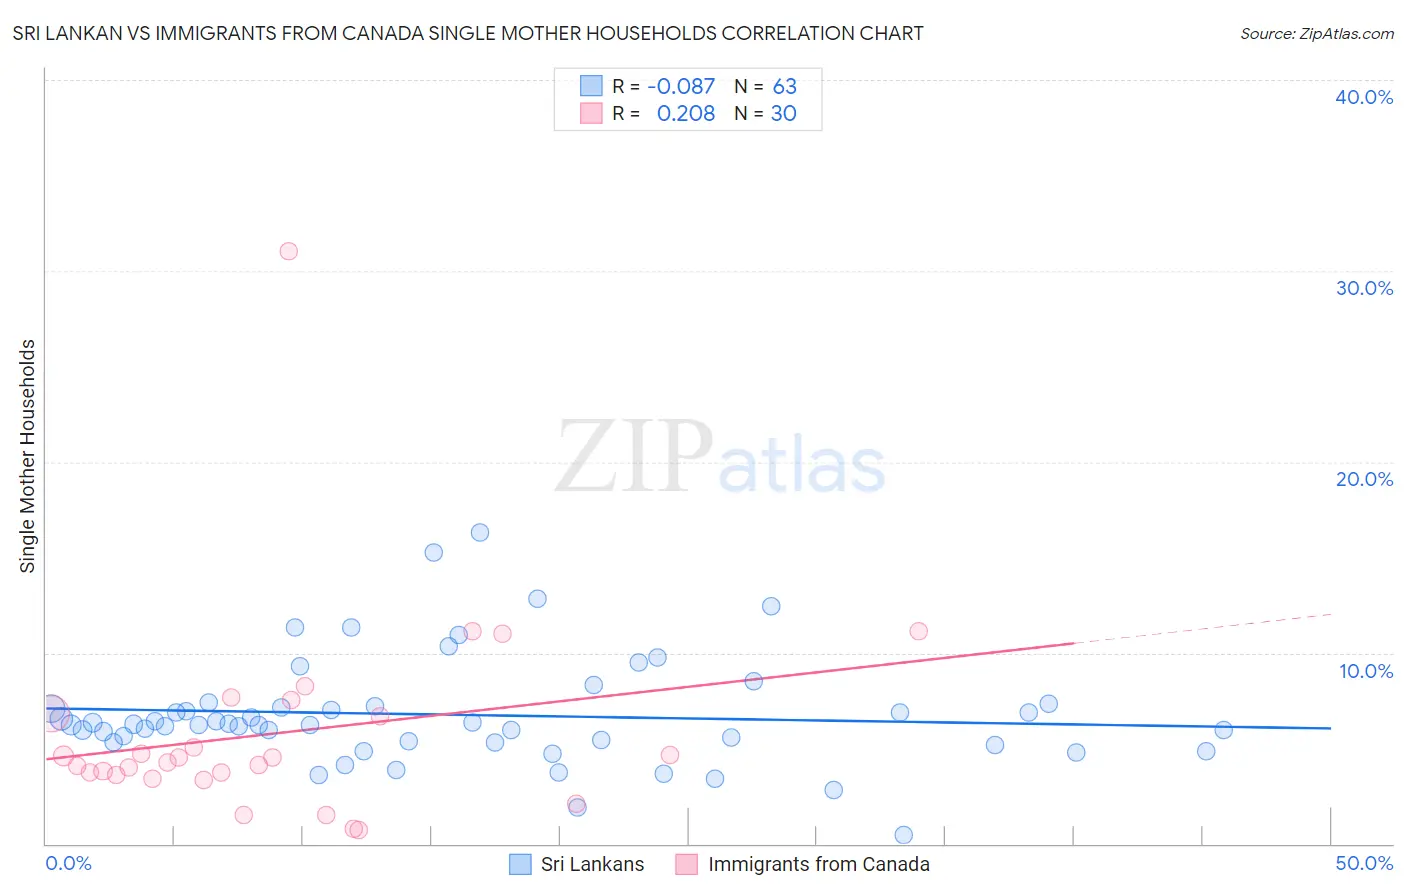
Sri Lankan vs Immigrants from Canada Single Mother Households Correlation Chart
The statistical analysis conducted on geographies consisting of 439,076,002 people shows a slight negative correlation between the proportion of Sri Lankans and percentage of single mother households in the United States with a correlation coefficient (R) of -0.087 and weighted average of 6.2%. Similarly, the statistical analysis conducted on geographies consisting of 457,332,787 people shows a weak positive correlation between the proportion of Immigrants from Canada and percentage of single mother households in the United States with a correlation coefficient (R) of 0.208 and weighted average of 5.6%, a difference of 11.2%.
Single Mother Households Correlation Summary
| Measurement | Sri Lankan | Immigrants from Canada |
| Minimum | 0.45% | 0.70% |
| Maximum | 16.3% | 31.0% |
| Range | 15.8% | 30.3% |
| Mean | 6.8% | 5.8% |
| Median | 6.3% | 4.4% |
| Interquartile 25% (IQ1) | 5.3% | 3.6% |
| Interquartile 75% (IQ3) | 7.2% | 6.8% |
| Interquartile Range (IQR) | 1.9% | 3.2% |
| Standard Deviation (Sample) | 2.8% | 5.5% |
| Standard Deviation (Population) | 2.8% | 5.4% |
Similar Demographics by Single Mother Households
Demographics Similar to Sri Lankans by Single Mother Households
In terms of single mother households, the demographic groups most similar to Sri Lankans are Immigrants from Syria (6.2%, a difference of 0.43%), Immigrants from Northern Africa (6.2%, a difference of 0.50%), Brazilian (6.2%, a difference of 0.57%), Alsatian (6.2%, a difference of 0.60%), and Immigrants from Chile (6.3%, a difference of 0.65%).
| Demographics | Rating | Rank | Single Mother Households |
| Yugoslavians | 73.1 /100 | #159 | Good 6.1% |
| Iraqis | 73.0 /100 | #160 | Good 6.1% |
| Immigrants | Germany | 72.4 /100 | #161 | Good 6.1% |
| Immigrants | Zimbabwe | 69.9 /100 | #162 | Good 6.2% |
| Alsatians | 68.7 /100 | #163 | Good 6.2% |
| Immigrants | Northern Africa | 68.0 /100 | #164 | Good 6.2% |
| Immigrants | Syria | 67.4 /100 | #165 | Good 6.2% |
| Sri Lankans | 63.9 /100 | #166 | Good 6.2% |
| Brazilians | 59.1 /100 | #167 | Average 6.2% |
| Immigrants | Chile | 58.3 /100 | #168 | Average 6.3% |
| Puget Sound Salish | 58.1 /100 | #169 | Average 6.3% |
| Immigrants | Oceania | 54.6 /100 | #170 | Average 6.3% |
| Afghans | 52.5 /100 | #171 | Average 6.3% |
| Immigrants | South Eastern Asia | 52.2 /100 | #172 | Average 6.3% |
| Immigrants | Vietnam | 51.5 /100 | #173 | Average 6.3% |
Demographics Similar to Immigrants from Canada by Single Mother Households
In terms of single mother households, the demographic groups most similar to Immigrants from Canada are Italian (5.6%, a difference of 0.020%), Immigrants from Bulgaria (5.6%, a difference of 0.080%), Greek (5.6%, a difference of 0.10%), Asian (5.6%, a difference of 0.11%), and Immigrants from France (5.6%, a difference of 0.15%).
| Demographics | Rating | Rank | Single Mother Households |
| Luxembourgers | 98.7 /100 | #59 | Exceptional 5.6% |
| Immigrants | Norway | 98.7 /100 | #60 | Exceptional 5.6% |
| Australians | 98.7 /100 | #61 | Exceptional 5.6% |
| Poles | 98.6 /100 | #62 | Exceptional 5.6% |
| Immigrants | North Macedonia | 98.6 /100 | #63 | Exceptional 5.6% |
| Immigrants | France | 98.6 /100 | #64 | Exceptional 5.6% |
| Greeks | 98.6 /100 | #65 | Exceptional 5.6% |
| Immigrants | Canada | 98.5 /100 | #66 | Exceptional 5.6% |
| Italians | 98.5 /100 | #67 | Exceptional 5.6% |
| Immigrants | Bulgaria | 98.5 /100 | #68 | Exceptional 5.6% |
| Asians | 98.5 /100 | #69 | Exceptional 5.6% |
| Immigrants | Eastern Europe | 98.4 /100 | #70 | Exceptional 5.6% |
| Immigrants | Kazakhstan | 98.4 /100 | #71 | Exceptional 5.6% |
| Immigrants | Netherlands | 98.4 /100 | #72 | Exceptional 5.6% |
| Immigrants | Asia | 98.4 /100 | #73 | Exceptional 5.6% |