Sri Lankan vs Romanian Unemployment Among Ages 55 to 59 years
COMPARE
Sri Lankan
Romanian
Unemployment Among Ages 55 to 59 years
Unemployment Among Ages 55 to 59 years Comparison
Sri Lankans
Romanians
4.6%
UNEMPLOYMENT AMONG AGES 55 TO 59 YEARS
98.1/ 100
METRIC RATING
79th/ 347
METRIC RANK
4.7%
UNEMPLOYMENT AMONG AGES 55 TO 59 YEARS
82.7/ 100
METRIC RATING
139th/ 347
METRIC RANK
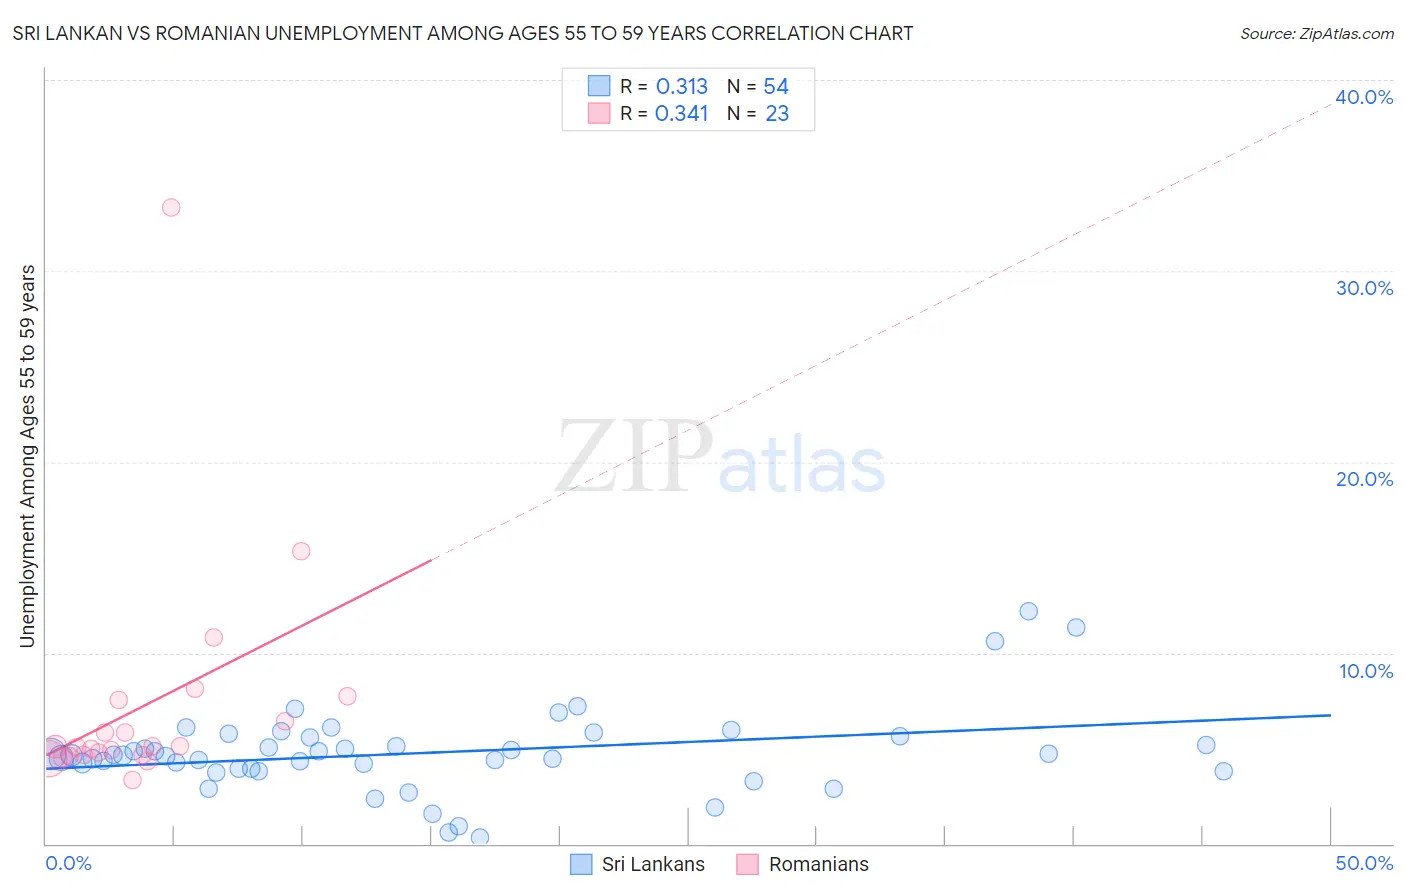
Sri Lankan vs Romanian Unemployment Among Ages 55 to 59 years Correlation Chart
The statistical analysis conducted on geographies consisting of 406,595,249 people shows a mild positive correlation between the proportion of Sri Lankans and unemployment rate among population between the ages 55 and 59 in the United States with a correlation coefficient (R) of 0.313 and weighted average of 4.6%. Similarly, the statistical analysis conducted on geographies consisting of 353,006,964 people shows a mild positive correlation between the proportion of Romanians and unemployment rate among population between the ages 55 and 59 in the United States with a correlation coefficient (R) of 0.341 and weighted average of 4.7%, a difference of 2.5%.
Unemployment Among Ages 55 to 59 years Correlation Summary
| Measurement | Sri Lankan | Romanian |
| Minimum | 0.30% | 3.3% |
| Maximum | 12.2% | 33.3% |
| Range | 11.9% | 30.0% |
| Mean | 4.8% | 7.2% |
| Median | 4.6% | 5.1% |
| Interquartile 25% (IQ1) | 3.9% | 4.7% |
| Interquartile 75% (IQ3) | 5.5% | 7.5% |
| Interquartile Range (IQR) | 1.6% | 2.9% |
| Standard Deviation (Sample) | 2.2% | 6.2% |
| Standard Deviation (Population) | 2.2% | 6.1% |
Similar Demographics by Unemployment Among Ages 55 to 59 years
Demographics Similar to Sri Lankans by Unemployment Among Ages 55 to 59 years
In terms of unemployment among ages 55 to 59 years, the demographic groups most similar to Sri Lankans are Cambodian (4.6%, a difference of 0.040%), Finnish (4.6%, a difference of 0.090%), Taiwanese (4.6%, a difference of 0.11%), Scotch-Irish (4.6%, a difference of 0.14%), and Immigrants from Bosnia and Herzegovina (4.6%, a difference of 0.15%).
| Demographics | Rating | Rank | Unemployment Among Ages 55 to 59 years |
| Immigrants | Taiwan | 98.7 /100 | #72 | Exceptional 4.6% |
| Bhutanese | 98.6 /100 | #73 | Exceptional 4.6% |
| Croatians | 98.5 /100 | #74 | Exceptional 4.6% |
| Immigrants | Iraq | 98.5 /100 | #75 | Exceptional 4.6% |
| Immigrants | Bosnia and Herzegovina | 98.3 /100 | #76 | Exceptional 4.6% |
| Scotch-Irish | 98.3 /100 | #77 | Exceptional 4.6% |
| Finns | 98.2 /100 | #78 | Exceptional 4.6% |
| Sri Lankans | 98.1 /100 | #79 | Exceptional 4.6% |
| Cambodians | 98.0 /100 | #80 | Exceptional 4.6% |
| Taiwanese | 97.9 /100 | #81 | Exceptional 4.6% |
| Latvians | 97.8 /100 | #82 | Exceptional 4.6% |
| Lebanese | 97.5 /100 | #83 | Exceptional 4.6% |
| Malaysians | 96.9 /100 | #84 | Exceptional 4.7% |
| Immigrants | Vietnam | 96.9 /100 | #85 | Exceptional 4.7% |
| Immigrants | Colombia | 96.9 /100 | #86 | Exceptional 4.7% |
Demographics Similar to Romanians by Unemployment Among Ages 55 to 59 years
In terms of unemployment among ages 55 to 59 years, the demographic groups most similar to Romanians are Immigrants from Switzerland (4.7%, a difference of 0.010%), Colombian (4.7%, a difference of 0.060%), Delaware (4.7%, a difference of 0.060%), Slavic (4.7%, a difference of 0.070%), and Panamanian (4.7%, a difference of 0.11%).
| Demographics | Rating | Rank | Unemployment Among Ages 55 to 59 years |
| Immigrants | Romania | 85.3 /100 | #132 | Excellent 4.7% |
| Immigrants | Netherlands | 84.5 /100 | #133 | Excellent 4.7% |
| Panamanians | 84.1 /100 | #134 | Excellent 4.7% |
| Slavs | 83.7 /100 | #135 | Excellent 4.7% |
| Colombians | 83.6 /100 | #136 | Excellent 4.7% |
| Delaware | 83.6 /100 | #137 | Excellent 4.7% |
| Immigrants | Switzerland | 82.9 /100 | #138 | Excellent 4.7% |
| Romanians | 82.7 /100 | #139 | Excellent 4.7% |
| Immigrants | Indonesia | 80.2 /100 | #140 | Excellent 4.8% |
| French Canadians | 80.1 /100 | #141 | Excellent 4.8% |
| Immigrants | Norway | 79.8 /100 | #142 | Good 4.8% |
| Ukrainians | 78.6 /100 | #143 | Good 4.8% |
| Immigrants | Asia | 77.8 /100 | #144 | Good 4.8% |
| Immigrants | Northern Europe | 77.5 /100 | #145 | Good 4.8% |
| Immigrants | South Eastern Asia | 77.4 /100 | #146 | Good 4.8% |