Immigrants from Turkey vs Immigrants from Canada Unemployment Among Ages 55 to 59 years
COMPARE
Immigrants from Turkey
Immigrants from Canada
Unemployment Among Ages 55 to 59 years
Unemployment Among Ages 55 to 59 years Comparison
Immigrants from Turkey
Immigrants from Canada
4.7%
UNEMPLOYMENT AMONG AGES 55 TO 59 YEARS
93.9/ 100
METRIC RATING
104th/ 347
METRIC RANK
4.7%
UNEMPLOYMENT AMONG AGES 55 TO 59 YEARS
94.9/ 100
METRIC RATING
97th/ 347
METRIC RANK
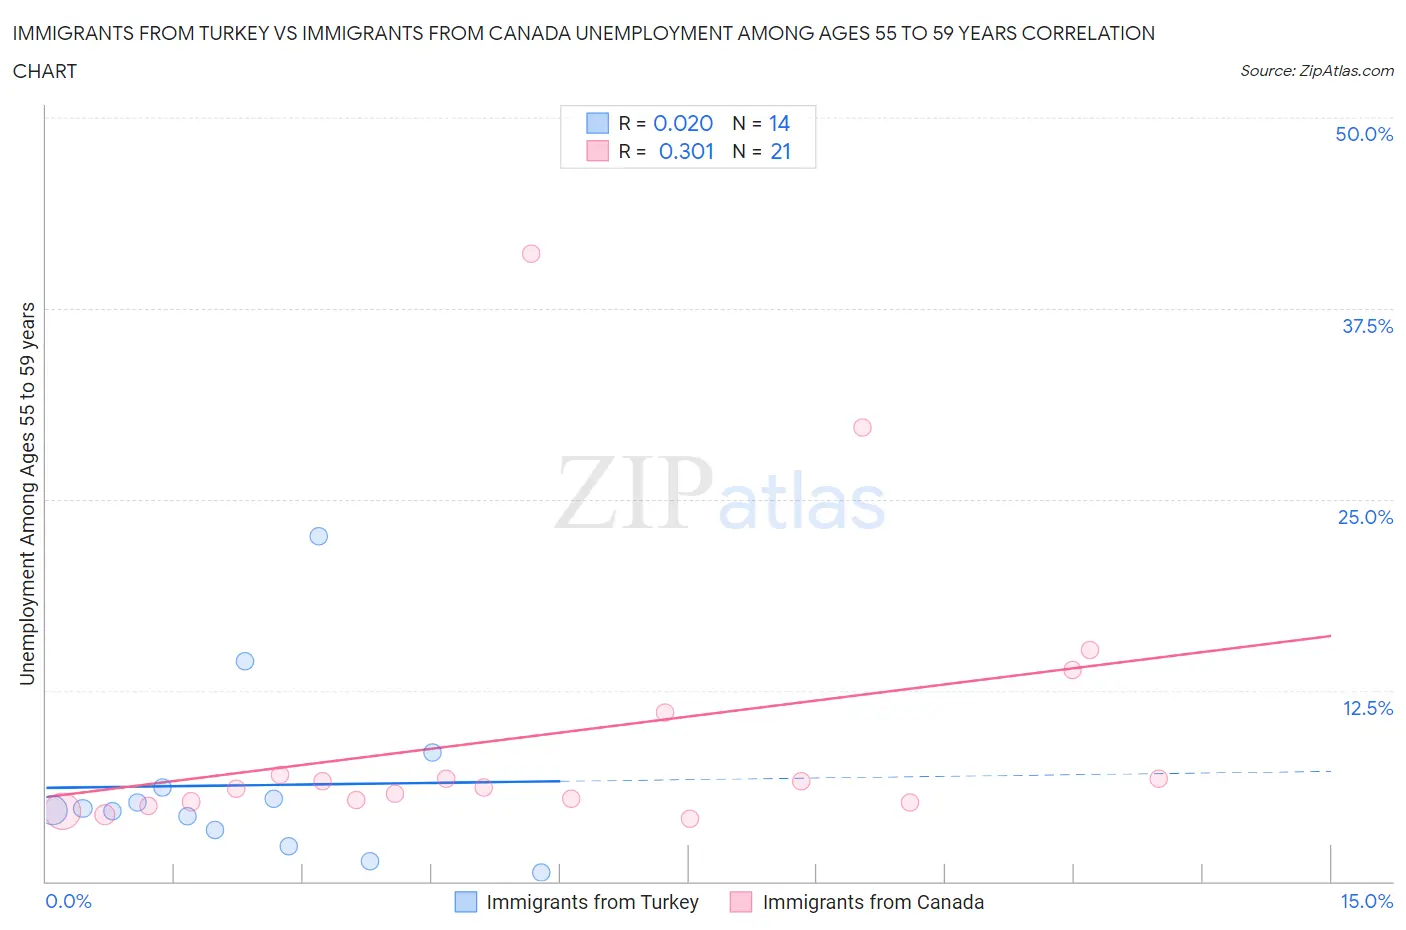
Immigrants from Turkey vs Immigrants from Canada Unemployment Among Ages 55 to 59 years Correlation Chart
The statistical analysis conducted on geographies consisting of 214,841,701 people shows no correlation between the proportion of Immigrants from Turkey and unemployment rate among population between the ages 55 and 59 in the United States with a correlation coefficient (R) of 0.020 and weighted average of 4.7%. Similarly, the statistical analysis conducted on geographies consisting of 417,489,457 people shows a mild positive correlation between the proportion of Immigrants from Canada and unemployment rate among population between the ages 55 and 59 in the United States with a correlation coefficient (R) of 0.301 and weighted average of 4.7%, a difference of 0.19%.
Unemployment Among Ages 55 to 59 years Correlation Summary
| Measurement | Immigrants from Turkey | Immigrants from Canada |
| Minimum | 0.60% | 4.1% |
| Maximum | 22.6% | 41.1% |
| Range | 22.0% | 37.0% |
| Mean | 6.3% | 9.6% |
| Median | 4.7% | 6.1% |
| Interquartile 25% (IQ1) | 3.4% | 5.2% |
| Interquartile 75% (IQ3) | 6.1% | 9.0% |
| Interquartile Range (IQR) | 2.8% | 3.8% |
| Standard Deviation (Sample) | 5.8% | 9.2% |
| Standard Deviation (Population) | 5.6% | 9.0% |
Demographics Similar to Immigrants from Turkey and Immigrants from Canada by Unemployment Among Ages 55 to 59 years
In terms of unemployment among ages 55 to 59 years, the demographic groups most similar to Immigrants from Turkey are Immigrants from North America (4.7%, a difference of 0.010%), Canadian (4.7%, a difference of 0.020%), Immigrants from Oceania (4.7%, a difference of 0.020%), Immigrants from Laos (4.7%, a difference of 0.020%), and Celtic (4.7%, a difference of 0.070%). Similarly, the demographic groups most similar to Immigrants from Canada are Immigrants from Belgium (4.7%, a difference of 0.010%), Immigrants from Germany (4.7%, a difference of 0.010%), Yugoslavian (4.7%, a difference of 0.040%), Serbian (4.7%, a difference of 0.11%), and Celtic (4.7%, a difference of 0.12%).
| Demographics | Rating | Rank | Unemployment Among Ages 55 to 59 years |
| Immigrants | Poland | 96.4 /100 | #90 | Exceptional 4.7% |
| New Zealanders | 96.3 /100 | #91 | Exceptional 4.7% |
| Iraqis | 96.1 /100 | #92 | Exceptional 4.7% |
| Immigrants | England | 95.8 /100 | #93 | Exceptional 4.7% |
| Immigrants | Scotland | 95.7 /100 | #94 | Exceptional 4.7% |
| South Africans | 95.6 /100 | #95 | Exceptional 4.7% |
| Immigrants | Belgium | 95.0 /100 | #96 | Exceptional 4.7% |
| Immigrants | Canada | 94.9 /100 | #97 | Exceptional 4.7% |
| Immigrants | Germany | 94.8 /100 | #98 | Exceptional 4.7% |
| Yugoslavians | 94.7 /100 | #99 | Exceptional 4.7% |
| Serbians | 94.4 /100 | #100 | Exceptional 4.7% |
| Celtics | 94.3 /100 | #101 | Exceptional 4.7% |
| Canadians | 94.1 /100 | #102 | Exceptional 4.7% |
| Immigrants | Oceania | 94.0 /100 | #103 | Exceptional 4.7% |
| Immigrants | Turkey | 93.9 /100 | #104 | Exceptional 4.7% |
| Immigrants | North America | 93.9 /100 | #105 | Exceptional 4.7% |
| Immigrants | Laos | 93.9 /100 | #106 | Exceptional 4.7% |
| Immigrants | Egypt | 93.5 /100 | #107 | Exceptional 4.7% |
| French | 93.3 /100 | #108 | Exceptional 4.7% |
| Chileans | 93.2 /100 | #109 | Exceptional 4.7% |
| Egyptians | 92.9 /100 | #110 | Exceptional 4.7% |